About Adsense Publisher Scorecard and how google should improve it. Also, we’ll look into why you shouldn’t do everything which the feature asks you to do.
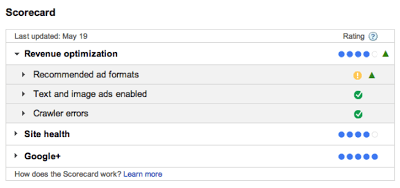
Well if you haven’t heard of it already, Google came out with a publisher scorecard which is a basically a checklist of what you need to do, to optimize your revenues and improve the user experience. If you’ve noticed, I’m not calling it a “benchmarking feature” as Google mentions it to be, but simply a checklist. Although they may be correct as far as the dictionary definition is concerned but I was expecting something better from Google, something which can match me against my peers and not merely the Industry best Practices.
Anyways, This tool is primarily divided into three segments – “Revenue Optimization, “Site Health” & “Google+”.
The intention of creating this post is to:
- Bring forward a few ideas which Google should include to make this checklist a real benchmarking feature, which can create tremendous value for its 2 million plus publishers.
- Second, to tell you why you should not do everything which this scorecard asks you to do.
Lets begin with what they should be adding first.
CTR Benchmarking
The biggest concern for every publisher is either improving his CTR or if already satisfactory, making sure it does not go down the hill. Further, webmasters have no way to compare or benchmark the CTR against the industry standard. Many a times, webmasters witnessing a low CTR would keep testing different site designs/layouts; ad positions to improve CTR, but Its not just about the website design, it is quite possible for the complete niche to have a low Advertisement CTR. We all know that some niches have higher click through rates as compared to others. I did such a comparison, sometime back, comparing the CTR between a Web Hosting & a Computer security site. With all other things being almost constant (ie SE as visitor source, same design, etc) I can easily say that the CTR for the hosting niche was 3 times more than the computer security site. Now, the scorecard tells you nothing about how well your site is performing in terms of CTR.
Google is a data-giant, we all know that. They also understand the value of data. For such a company to add a feature which lets you benchmark your CTR against similar sites in your niche is no difficult task and can actually help a lot of publishers.In fact, we already have something similar on the other side of the table – Adwords. If you have an Adwords account, pay the “Analyse competition” link a visit, under the “Opportunities” Tab. They’ve mentioned about this tool here. A similar tool or feature addition to this scorecard would be really good and will go a long way in helping out publishers in generating more revenue from their existing websites and of course, Google gets the cut too!
Site health
A sites’ health is not necessarily just represented by the speed or the response time. Of course, a lower response time is always appreciated but these are a few additional things which should be covered:
- Valid website code/WC3 validation – While controversial, but many believe that WC3 validation is a weak but easily controlled quality signal. Informing a webmaster about this, can help him improve his ranking and thereby, traffic.
- Meta information formatting and any issues relating to it can used as an indicator.
- Authorship – The value of Authorship as a ranking factor is debatable, but we all know how much Google likes it. I’ve personally found it be beneficial too. It helped me increase the CTR from the SERP to my website. It also helps improve the user experience by keeping spam away (most of the time).
- Reading Ease – Creating a Google powered reading ease test could really help publishers improve the usability of their websites.
- Here is a detailed website checklist. I’m sure Google will not like to cover a lot of the factors mentioned on the list, but a few specially the ones mentioned in the usability section will help.

Integration with Analytics
I’ve integrated a lot of Adsense websites with Analytics and the kind of insights it gives you access to, in a simple word are – amazing. Definitely worth making a check in the Scorecard. This integration it self can help you optimize content, improve user experience and grow revenue.
How?
- You’ll know which content on your site is generating the most revenue and you can work more, in that direction.
- You’ll be able to implement and compare changes based on user behaviour and earnings.
I could go on and on, but this post isn’t about the benefits of integrating with Analytics. So a long story, short – Integration with Analytics is really helpful and definitely deserves a spot in the checklist. - Similarly, I am sure they can add a few more checkpoints, based on the feedback they receive from other webmasters.
Where the scorecard went wrong
Now, coming to the second part of the post, regarding what you probably shouldn’t do is – enabling both Image and text ads. What Google has to say here is simple – You get access to a larger inventory of text + image ads combined and more advertisers are competing for your ad spot. More the competition, higher the probability of landing an ad with better Quality Score and CPC. After all its an auction.
Incorrect. My view on the matter is completely different. When you have a choice at hand, TEST. Don’t do what someone tells you to do. I’m sure it definitely sounds weird when I ask you not to do what Google says is good. However, A/B Testing image vs Text ads is definitely worth a shot. Each website is different and there is no sure shot way of telling you what will work better on your site, but generally it is seen that Image ads perform better than text ads, in terms of CTR. But wait, don’t just change your ad code right now. Whats even more interesting is that even though text ads generally get a lower CTR, but they’ll give you a better eCPM. In short, you’ll end up making more money by showing them, even after a lower CTR. Again, as I’ve said before, no two website are alike, the best way to know for sure is by A/B testing image vs text ads. I’ve seen this trend on many websites and I am not alone. We’ll be posting a lot of case studies on this blog once we enter into Public Beta for our ad revenue optimization tool.
Similarly, using the recommended ad format simply means using larger ads. Of course, it is true that larger ads occupy more space and generally they get more clicks. However, it is not true in all the cases. Some sites actually perform better with smaller ads, specially when the smaller size complements the overall design. In fact, some sites have themes with smaller sizes and they just can’t use large ad units. Hence, the Google recommended ad formats may be good for the majority by not beneficial to all websites.
No Personalization
As stated earlier, what Google recommends for majority might not be beneficial to your website. Why? Simply because Scorecard represents what worked well for the industry as a whole. This means there are lots of extremes that it doesn’t consider, and simply states the “average best” – the best ad format/size/color which works for the majority of the publishers. What works best for the industry overall might not be optimal for your industry vertical or niche, your kind of visitors or your website’s layout. Personalization is the key here. To achieve the maximum ad revenue optimization, you need to test and see what works well for your website personally. Of course, there are multiple ways to do this, and there are tens of variables that come into play (ad color, ad type, ad size, ad position, ad font..!), which makes the manual testing not-so-easy. Here’s where Ad Pushup makes the job easier for you (hint: we’re inviting beta users).
Conclusion
Well, we’ve tried to see how well Adsense Publisher Scorecard stands, and although it has some drawbacks, it is a welcome addition in Adsense. Hopefully, it will catch attention of many publishers doing little to none Adsense revenue optimization, and will steer them into adopting such practices, ultimately leading to increased adsense revenues. But for the publishers who really want to squeeze every drop of possible revenue, the Publisher Scorecard isn’t very effective. That being said, its a relatively new add-on at the time of writing, and we hope Google will improve it with more features. We’ll post about the changes as they happen, so keep watching this space!
FAQs
CTR is Click-Through Rate Benchmarks. A link’s average click-through rate (CTR) is the ratio of clicks to impressions. The CTR is based on the average of your entire campaign, not each individual keyword.
CTR measures how often users click on your ads. In general, the average CTR for search and display ads is 1.9%. Specifically, search ads have an average CTR of 3.17% and display ads have an average CTR of 0.46%.
An ad’s CTR is calculated by dividing the number of clicks it receives by the number of impressions it receives: clicks ÷ impressions = CTR. In the case of 5 clicks and 100 impressions, your CTR would be 5%.
CTR is an important metric since it tells you what works (and what doesn’t) when you’re trying to reach your target audience. Low CTRs could indicate that you’re targeting the wrong audience or that you’re not speaking their language convincingly.
Ankit is a co-founder @ AdPushup (a tool which helps online publishers optimize ad revenues) and loves online marketing & growth hacking.