This post has been written keeping in mind large web publishers but I’m confident that it will inspire and give testing ideas to everyone. Remember, in optimization of anything, there is no one commandment that rules all; only testing and implementation.
It expands on the following topics:
- Using viewport[footnote]In web browsers, viewport is the user’s visible area (typically rectangular) of a web page and it is usually measured in pixels. It differs in size according to the device, like mobile/desktop/tablet.[/footnote] time as a better metric for measuring user engagement on desktops.
- Science backed tactics for increasing user engagement (fair warning: these will take time to show results)
Disclaimer: End results may vary for different publishers. This is because of variables like your niche, audience demographic and size, content type, geo-location, and language (among others). However, this does not negate the merit of testing what has been suggested herewith.
For those who don’t know yet, ‘user engagement’ is the primary goal (and the toughest nut to crack) for large scale publishers.
Why is User Engagement So Important?
Well, it’s the top metric which demonstrates you have an audience. When you have an audience you can confidently expect that there is someone always out there to consume your content (free or paid) when it gets published. Essentially, having an audience that comprises of returning users helps in ensuring the sustenance of your business.
For publishers who monetize their websites with ads; the basic math is: higher the volume of page-views (traffic) = the higher the probability of visitors clicking on ads.
But if the time that each visitor spends per page is increased > increased ad viewability > even higher probability of visitors clicking on an ad. This also helps in decreasing accidental clicks because it can be reasoned that a visitor with a high ‘time on page’ session has had the chance to sufficiently view and mentally process the ad content and therefore, chooses to interact with it.

Now having briefly given a context of why user engagement is crucial for large publishers, let’s move on to the meat of this post i.e. science and research backed methods to increase user engagement on a website.
Measuring Engagement via ‘Viewport’ (On Desktops)
In a study led by researchers from Google and Yahoo, they argue that although dwell time[footnote]Dwell time is the measure of the actual duration of time that a visitor spends on a page before returning to the SERPs.[/footnote] is a good metric to measure the performance of user engagement; it does not take into account user attention by page section. It does not show that time spent by users on a page can also be affected by page properties like its content length and type (e.g. long form editorials, slideshows, videos).
Taken from the study, the image below shows viewport data collected via 267,210 page-views on 1,971 news articles on a major online news website
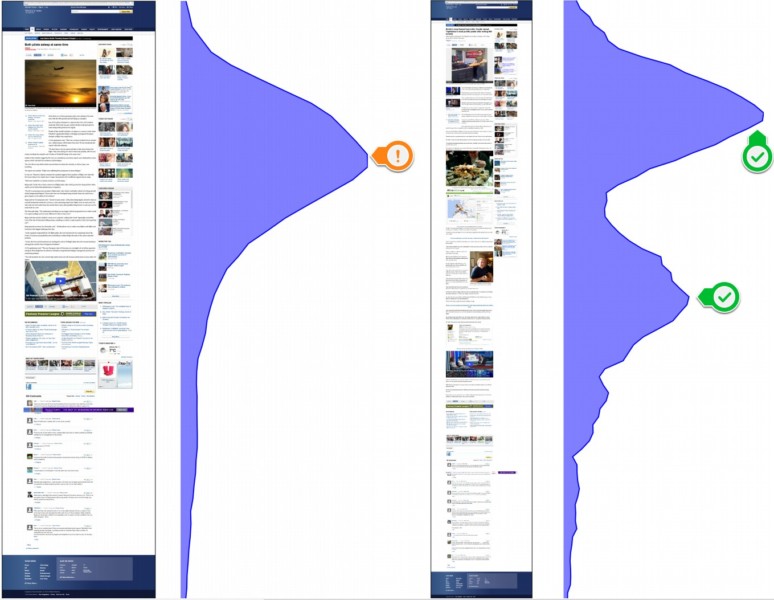
You can clearly see that the page on the right has a higher dwell time than the page on the left. But for a publisher who is looking to drill down and optimize user engagement—dwell time alone is not the best metric because it cannot separately show the increase in user attention as shown in the second half of the page on the right (remember: dwell time shows total time spent on a page, not where it was spent). This can lead to the loss of a potential opportunity to increase ad revenue where when that section could have been monetized with a well-placed ad unit.
Now in the image below, the same researchers used viewport time to measure user attention from overall page-views data:
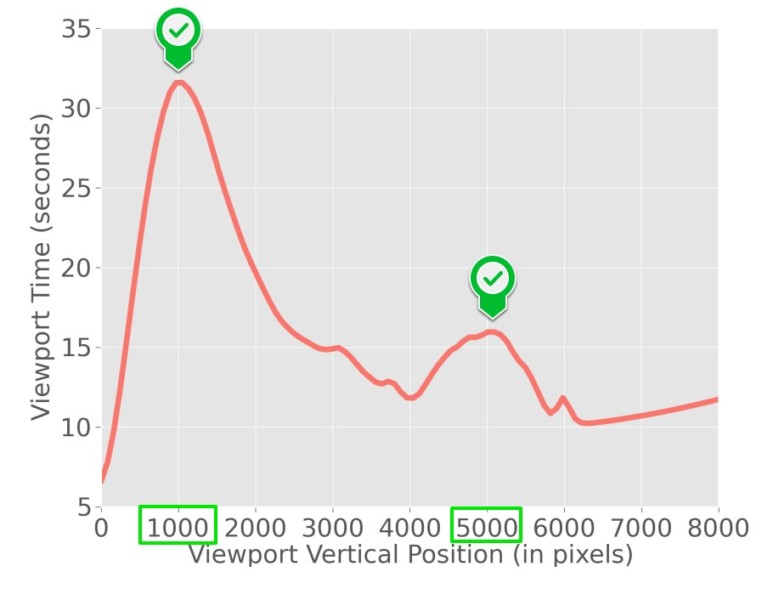
It’s interesting to note here that although it is common knowledge that visitors spend most time on the top of the page, they also had considerable content consumption near 5000 pixels.
But the above figure still does not answer the essential question on article reading dynamics which is “How do visitors consume content and at what stage of navigation do they decide to leave?”
In the final part of their study, the researchers focused on answering this very question by using the Markov mixture model[footnote]Markov model is a mathematical model that is used to predict the behavior of randomly changing variables. Here it is assumed that the future variables rely only on their current state, not how they occurred before it.[/footnote] and creating user cluster patterns that predict future behavior.
Applying these clusters (which include the viewport time) they created four user attention categories of which would be better metrics to measure overall user engagement. These are:
- Bounce: user did not engage with the article and left within 10 seconds after arriving
- Shallow engagement: user stays and reads 50% of the article
- Deep engagement: user reads more that 50% of the article (means he had to scroll down which indicates commitment)
- Complete engagement: user posts a comments or a reply on the article
Key Findings from the Study
- Visitors tend to stay twice longer when the first article that they landed on starts with an image as compared to articles without an image on top.
- Visitors start losing interest near the bottom of the page; regardless of the fact even if the amount of content on the bottom is similar to the content on the top.
- Media objects (images, videos) definitely entice users to the content BUT they have no effect on whether a user wants to read an article or not.
- Although it seems obvious, it can now be scientifically argued that for large publications the article length or the presence of enticing media is not what encourages visitors to read, but the actual content itself and how it’s presented.
Takeaway
There is no secret sauce. When it comes to confidently increasing user engagement—create and publish great content. It takes time and it might not always be great but it’s your best chance to maximize readership which in turn maximizes ad viewability and the chance to maximize ad revenue.
Research-Backed Tactics for Increasing User Engagement
This part is quite straight forward because I list down research backed methods which have proven to increase visitor engagement on large publications. I have only included 3 for now because I firmly believe that all of us do suffer from analysis paralysis and that it’s best to focus on one thing only and do it proper.
The tactics are:
- Story-focused articles perform best for large publications. Articles containing healthy use of interlinking related to the same story also keep the visitor hooked on to the content (Source)
- Decrease elements that deter engagement like information overload, pop-ups, communication tools that delay feedback and the requirement to multi-task (Source)
- Everyone knows it but that doesn’t mean they have committed to it: Users really care about response time so reduce it as much as possible (Source)
For now these should be enough to keep you occupied. Some of you might be wondering why the ‘measuring‘ section was lengthier than the ‘increasing‘ one. Well, speaking from experience, quite a lot of us are just looking for magic (or quick) solutions to end the strategic pain-points of our businesses but unfortunately such solutions are difficult to create because every business is different. So the best thing to do in such cases is to look for the data that you already have in your system (historical and current). Create tests and experiments based on them. Record results, rigorously optimize, implement and repeat.
Pick up what you can from people’s experience and online literature but the best and most sustainable solution that you can expect, is almost always with you only.
If you have any questions for me, then please do write them down in the comments below.
Note: In the interest of transparency and maintaining expectations, I strongly recommend that you go through the studies mentioned in this article to have a fuller conceptual understanding of all the variables involved and how applicable they are to your website(s).

Shubham is a digital marketer with rich experience working in the advertisement technology industry. He has vast experience in the programmatic industry, driving business strategy and scaling functions including but not limited to growth and marketing, Operations, process optimization, and Sales.