Header bidding implementation has always been a bit technical. But publishers equate complicated implementation with complex debugging. This is not always true. After implementing header bidding on their website via Prebid.js, non-technical publishers are not sure how to find out if the demand partners are actually bidding and if requests are being sent to all partners alike. But it’s actually pretty simple to find out.
There are some ways to debug prebid:
1. The Developer Console
Add “?pbjs_debug=true” at the end of the URL you want to debug.
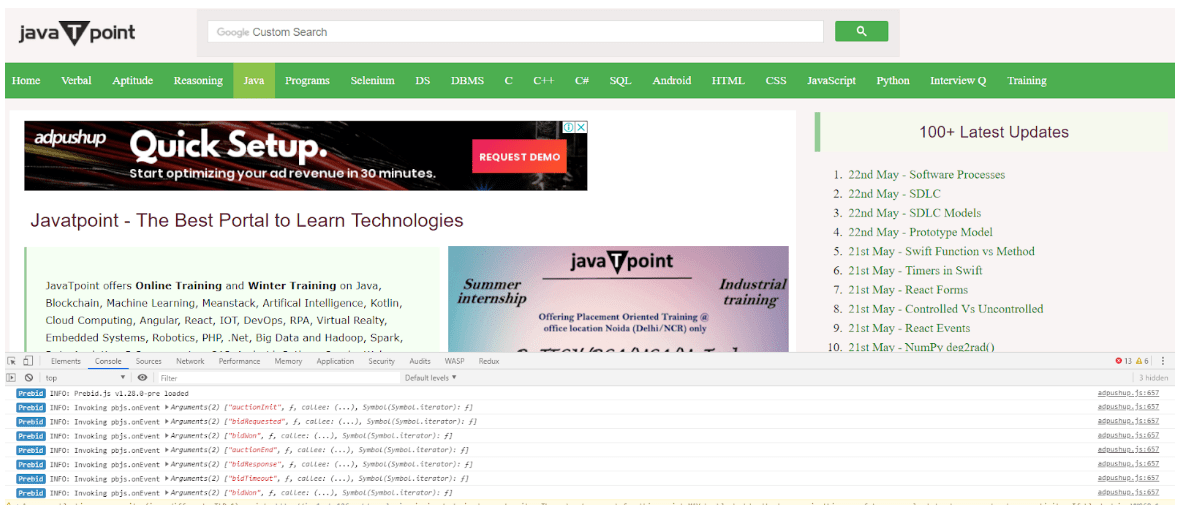
This will result in the console showing a lot of Prebid details and parameters including “bid responses” and “bids won”.
You can also call these functions separately via the console by simply typing.
- pbjs.getBidResponses() returns all Bid Responses
- outpbjs.getAllWinningBids() returns all Winning Bids
- pbjs.getAdserverTargeting() returns all the ad server targeting that has been set
2. Chrome Extension
This is the easiest method out there to view the ad requests that were sent, the demand partners they were sent to, the responses received to those ad requests, and how much time the responses took.
These are the list of questions that can be clarified via these extensions:
- What’s the latency from each header bidding partner?
- Do they load asynchronously or are they blocking my pages?
- Are they all loaded together in parallel?
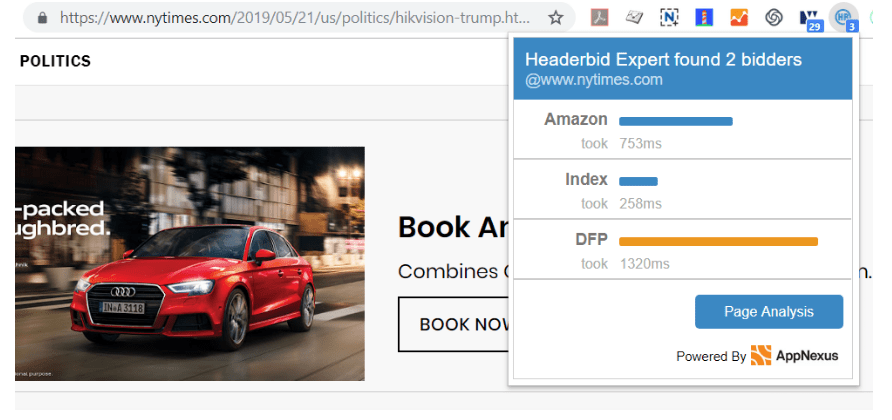
The sample NY Times Page here (in the screenshot above) sent requests to both Amazon and Index Exchange and both of them returned a bid in 753 ms and 258ms respectively.
There are a number of these header bidding extensions on the Chrome Store to choose from but Headerbid Expert is the most popular of them all.
Other popular extensions on the chrome store include:
3. The Ad Server Console
DFP’s developer console usually provides information such as targeting, latency, and key events logging.
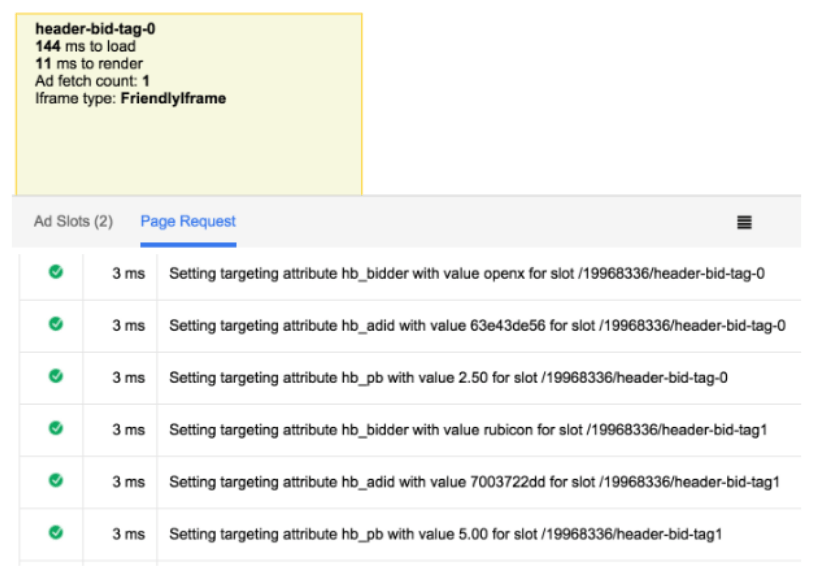
(DFP Console can be enabled by typing “googletag.openConsole()” in the console.)
This information provides directional information regarding all calls working well and all targeting being set right w.r.t ad units.
4. Listing All Bids Received
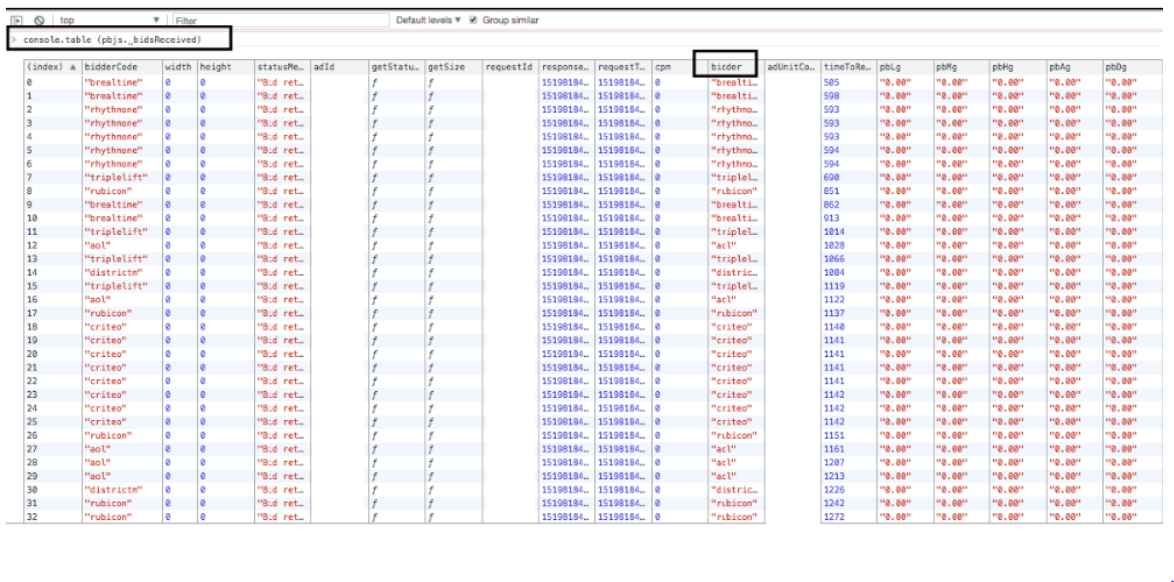
There is an easy method that will make sure all the bids received are listed down in a tabular format in the browser console itself.
This is as easy as going to the console and typing ‘console.table (pbjs._bidsReceived)‘ to get a high level information of the bids
5. Running Header Bidding Queries in DFP
Filtering DFP reports by key values in the Ad Manager Interface lets one find out if there are any discrepancies between what was recorded by the demand partner and what was eventually served with DFP.
All you have to do is include key values while building the query.
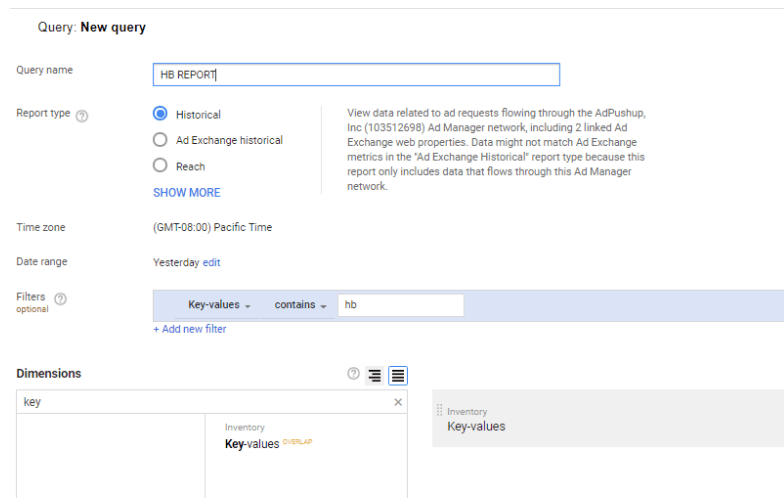
The reports loaded thereafter will give you an idea of the number of bids that were recorded within each bucket and will also allow you to match these with the demand reporting.

Although debugging prebid code sounds complicated, these methods listed above can provide a head start to you as a publisher before you reach out to your developer for help.
AskAdOps is a weekly column in which Shubham Grover, Product Specialist at AdPushup, answers the most commonly asked questions publishers have about ad operations. If you have a question you want answered, just send in an email at askadops@adpushup.com

Shubham is a digital marketer with rich experience working in the advertisement technology industry. He has vast experience in the programmatic industry, driving business strategy and scaling functions including but not limited to growth and marketing, Operations, process optimization, and Sales.


