We have covered essential mobile app monetization statistics for 2025. Read them and transcribe your informed decisions into revenue.
The mobile app ecosystem is more competitive than ever. With thousands of apps flooding the market, app publishers need to go the extra mile to capture their target audience and retain their users. All this while building a sustainable revenue stream from their app.
Numbers speak for themselves. According to TargetVideo, the average mobile phone user spends over 90% of their time on apps, against only 10% on web browsing. With billions of users worldwide spending more time in apps than on the web, the possibility of generating revenue through mobile has never been higher.
Our blog lays out the most relevant mobile app monetization statistics for 2025 to assist app publishers in making better, data-driven decisions.
Essential Mobile App Monetization Statistics for 2025
6 Mobile Usage Statistics
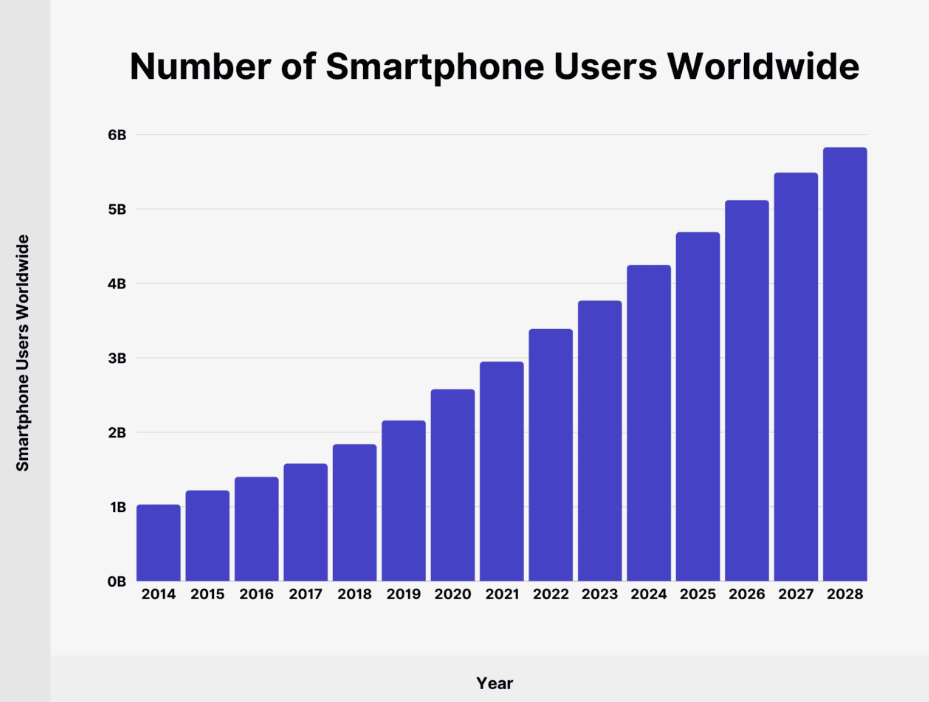
- Since 2022, smartphone users worldwide have increased by 38.38%, adding 1.3 billion new smartphone owners. By 2025, it is anticipated that 4.69 billion individuals will own smartphones. That’s an increase of 440 million new smartphone users over the previous year alone (between 2024 and 2025). This number is set to increase to 5.83 billion users by 2028. (Backlinko)
- Every day, people spend an average of 3 hours and 46 minutes online using cell phones (DataReportal). However, the same study by Backlinko suggests that the daily smartphone usage can range from as little as 1 hour and 48 minutes to as much as 6 hours and 16 minutes, depending on the apps the users use. At the same time, mobile accounts for 56.9% of daily internet time among users aged 16 and above worldwide.
- Indonesians spend the most number of hours each day on their mobile phones (6.05 hours), followed by Thailand (5.64 hours) and Argentina (5.33 hours). (SensorTower)
- According to eMarketer, by 2025, American individuals (aged 18 and over) are expected to spend an average of 4 hours and 2 minutes each day on the internet via smartphones.

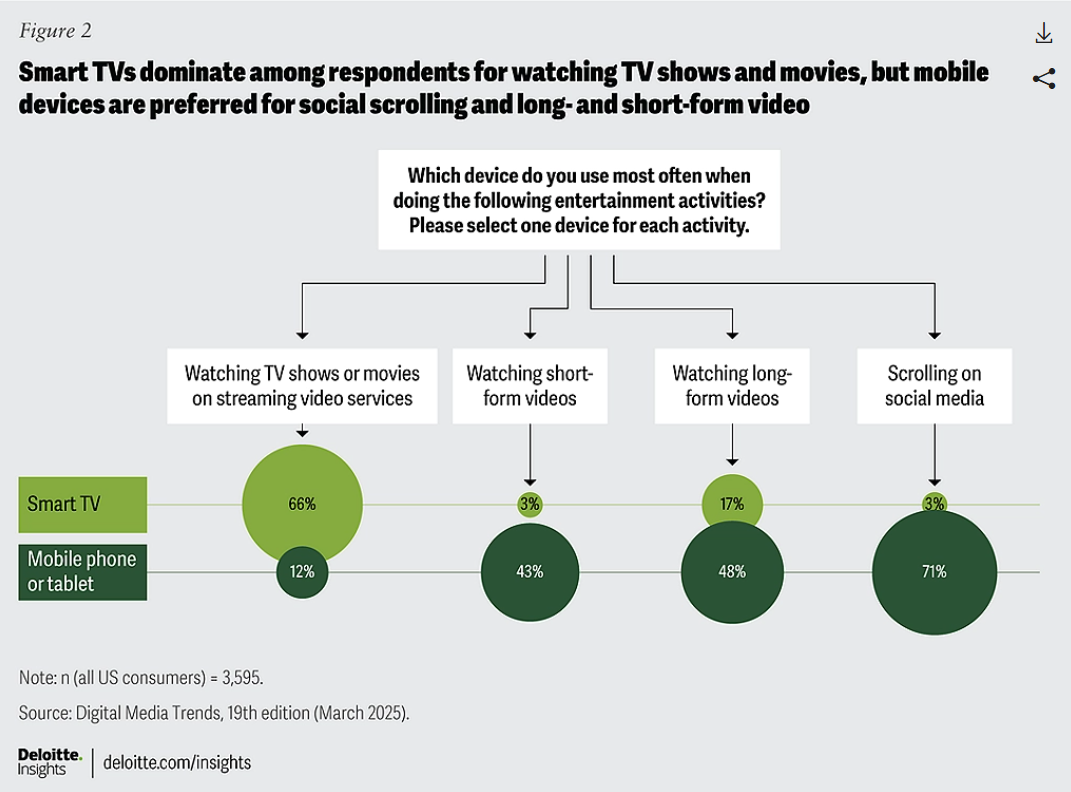
- According to a Deloitte report, 71% of Americans use mobiles to scroll social media content, 48% for long-form videos, and 43% for short-form videos.
- In 2025, mobile apps will have a definite preference over mobile websites, with 70% of sales made through them. (WiserNotify)
2 Mobile App Revenue Statistics
- Apps are at the forefront of digital revenue generation. With verticals such as in-app purchases, subscriptions, and generative AI driving the game, such apps are now reshaping how brands monetize experiences. App revenue is predicted to reach $613 billion in 2025, up from $522.7 billion in 2024, and to rise even higher to $673.8 billion in 2027. (Design Rush)
- The average iPhone user spends $12.77 per app. In comparison, the average Android user pays $6.19 for each app. The average in-app purchase on iPhones is $1.07, whereas the average transaction on Android is $0.43. (Exploding Topics)
5 App Retention Rate Statistics
- As per Business of Apps, by day 30, iOS apps retain 3.7% of users, significantly outperforming Android, which stands at 2.1%. At the same time, iOS also offers a stronger one-day app retention rate of 23.9%, against Android’s 21.1%. (DesignRush)
- Regarding android day 30 retention rates, Japan is far ahead of the rest of the world, with an astounding 4.15%, significantly exceeding the United Kingdom’s 2.73%. Other developed countries, such as France and Germany, outperform the average rates. Countries with lower rates than the norm include Vietnam, Nepal, and Indonesia. (AppsFlyer)
- The same study by AppsFlyer says that certain developed nations on iOS platforms, such as the United Kingdom (3.22%) and the United States (3.02%), have lower retention rates than the average. These two major markets are surpassed by smaller European countries such as Norway, Belgium, and Denmark.
- Users who interact weekly with the app are 90% more likely to stick around in the long run, demonstrating that weekly engagement strongly predicts retention. If you can attract people back consistently in the first week, the user is more likely to form long-term habits. (DesignRush)
- As per the same study, the 2024 data indicates that the average app retention percentage lowers to 21% after the first 24 hours, 7.5% by day 10, and 1.89% after 90 days.
7 App Store Statistics
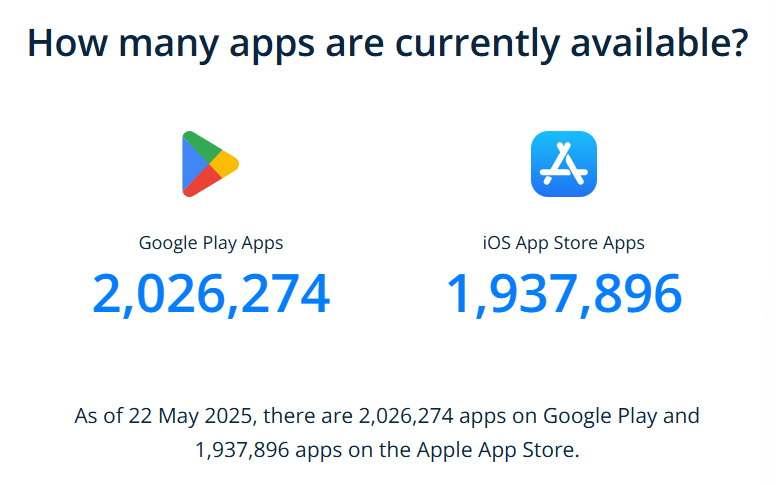
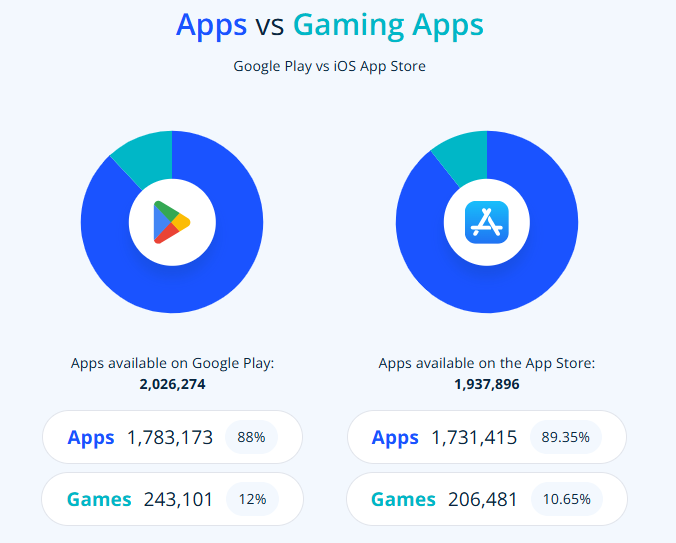
- Nowadays, users face an abundance of choices. As of May 2025, Google Play has 2,026,274 apps, while the Apple App Store has 1,937,896 apps. (42Matters)
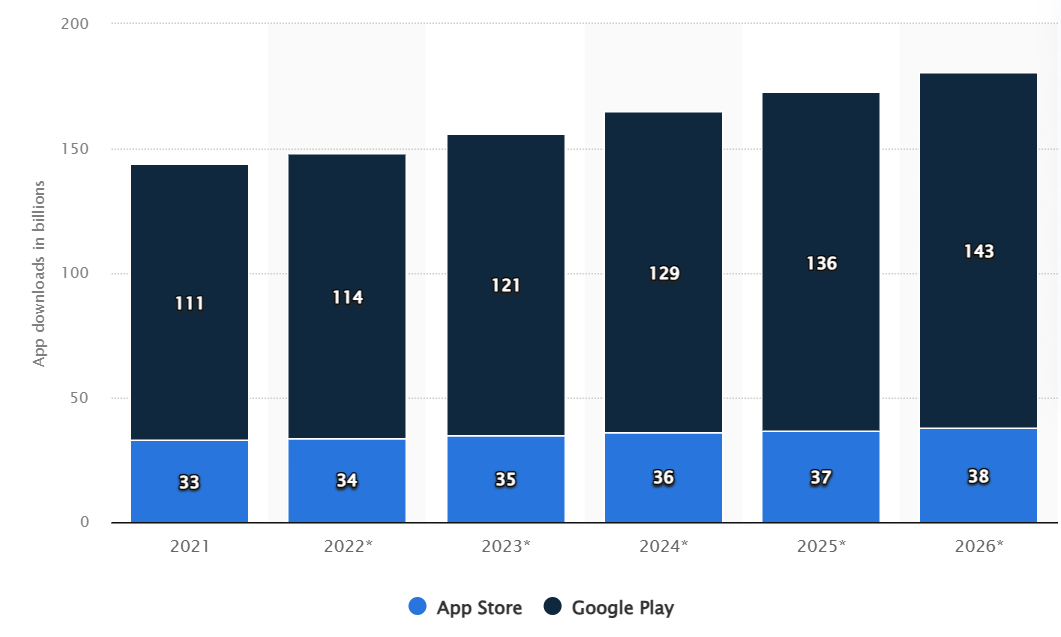
- In 2026, users are expected to download 143 billion mobile apps from the Google Play Store, up from 111 billion in 2021. In comparison, customers will download around 38 billion apps from the Apple App Store in 2026, up about 15% from 2021. (Statista)
- TikTok was the top downloaded app in the Google Play Store globally in February 2025, with about 65 million Android users downloading it. WhatsApp was the second most popular app, with over 41 million downloads from worldwide users. (Statista)
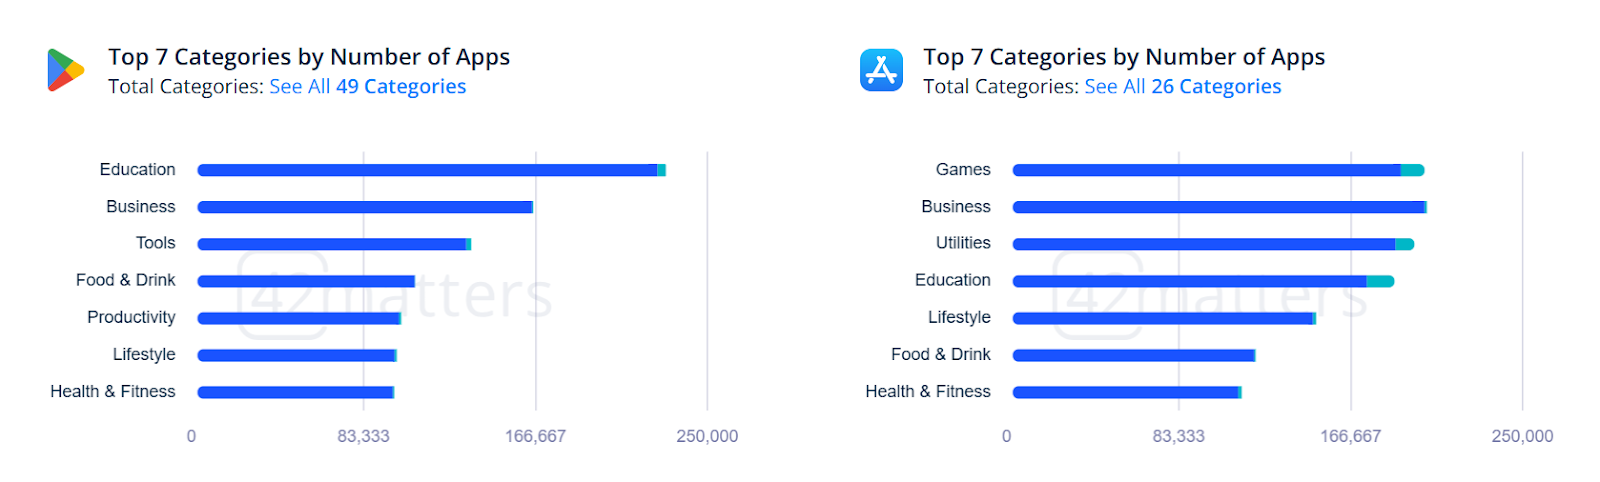
- According to the same study by 42Matters, ‘education’ is currently the most popular Android category, with 225,757 free and 6,652 paid apps. In contrast, the most popular iOS genre is ‘Games.’ It consists of 14,114 commercial apps and 190,929 free apps.
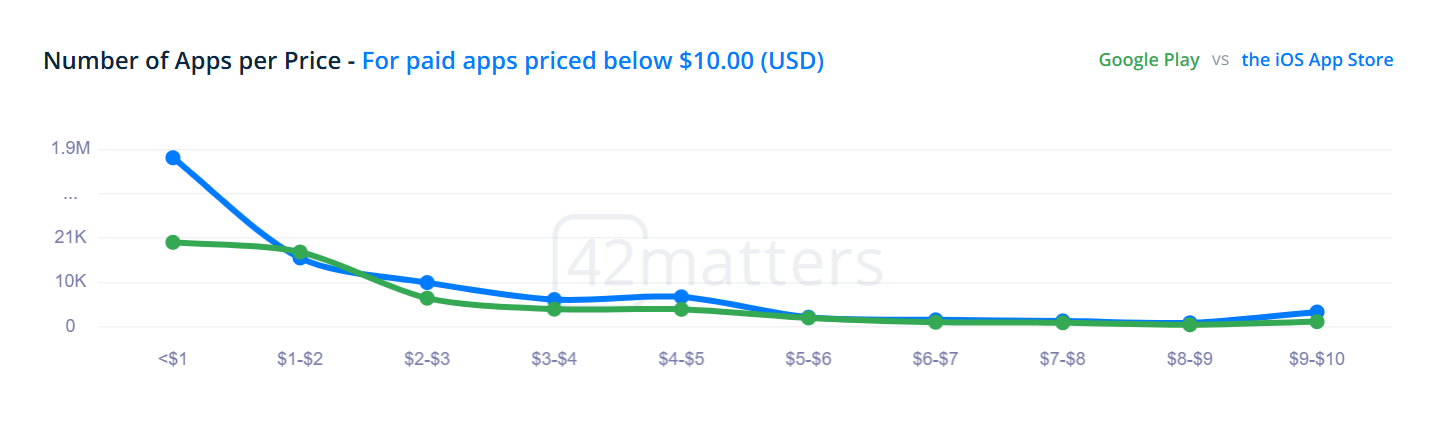
- The platform further states that Apple’s App Store has a notably higher number of apps priced under $1 than Google PlayStore.
- According to a survey, iOS users spend 2.5 times more than Android users on in-app purchases. (Android Authority)
- Google Play Protect scans 125 billion apps every day to help keep users safe from malware and harmful software. If Google Play Protect detects a potentially hazardous app, it can take several actions, including issuing a warning, restricting app installation, or automatically disabling the app. (Google Blog)
5 Mobile Video Ads Statistics
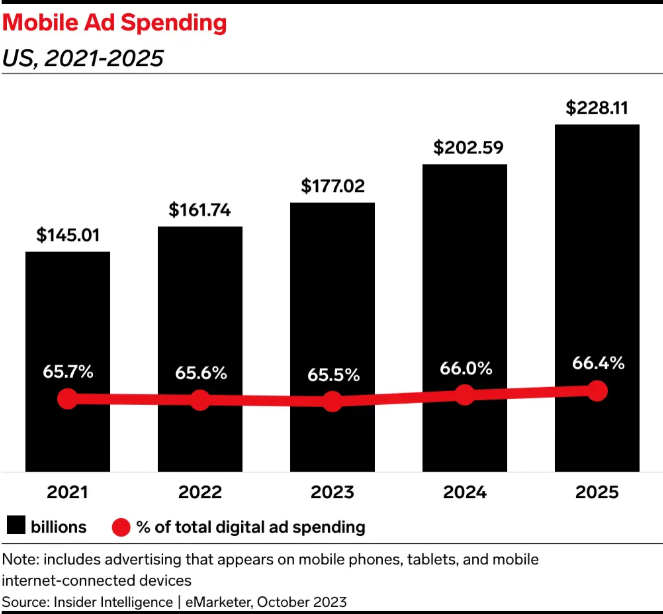
- Marketers have recognized how important smartphones are in reaching their audiences. Mobile ad spending in the US is set to touch $228.11 billion in 2025, representing 66.4% of the total ad spend. This is a 12.6% increase from $202.59 billion in 2024. (eMarketer)
- Video content is the dominant force in mobile marketing due to its ability to engage users effectively. Mobile video advertising is expected to account for over 75% of overall mobile advertising spending by 2025. (Global Banking & Finance)
- The global mobile video optimization market is set to reach $1.44 billion by 2034, accelerating at a CAGR of 7.2%. (FactMr)
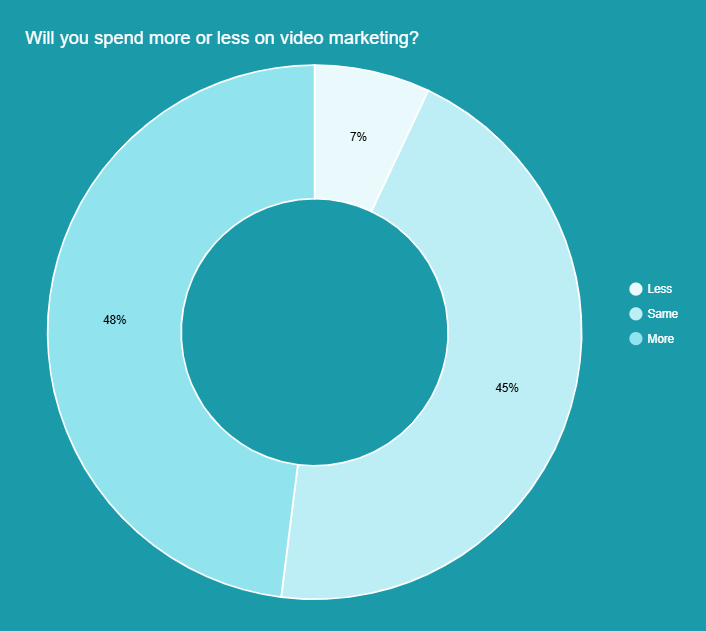
- The majority of marketers (93%) expect to spend the same amount or more on video marketing in 2025. (Wyzowl)
- The same study has highlighted that around 81% of those who saw a video about an app on their smartphones downloaded it. This emphasizes the need for mobile video optimization.

6. Gaming App Statistics
- Mobile applications are divided into two categories: apps and games. Presently, Google Play provides 1,783,173 mobile apps and 243,101 mobile games. In contrast, the App Store has 1,731,415 apps and 206,481 games available. (42matters)
- Mobile games have an average revenue per paying user (ARPU) of approximately $16.50. (GitNux)
- Further findings from GitNux indicate that the gaming applications produce an average revenue of $15 per user per year, whereas non-gaming apps generate an average of $3. (GitNux)
- According to Business of Apps, Honor of Kings was the top-grossing game in 2024, with $1.86 billion in in-game revenue, all with in-app purchases.
- Mobile gamers are expected to grow 8%, reaching 137 million by 2027. (Adapty)
- The same Adapty study states that the average revenue per user (ARPU) in the mobile gaming app market is estimated to be $57.64 this year, rising to $64.26 in 2027. With an average of 160 active users per app monthly, this niche has high-income potential.
4 In-app Advertising Statistics
- Ad spending in the global In-App Advertising market is expected to reach $390.04 billion in 2025. The market is estimated to expand at an annual rate of 8.17% (CAGR 2025-2029), resulting in a projected market volume of $533.92 billion in 2029. (Statista)
- Statista’s research further reveals that the average ad expenditure per mobile internet user in the In-App Advertising industry is expected to reach $59.23 in 2025 in 2025.
- The United States continues to lead in innovation and investment, driving industry trends in in-app advertising. When compared globally, the United States is expected to generate the most advertising spending, hitting US$147.52 billion in 2025. (Statista)
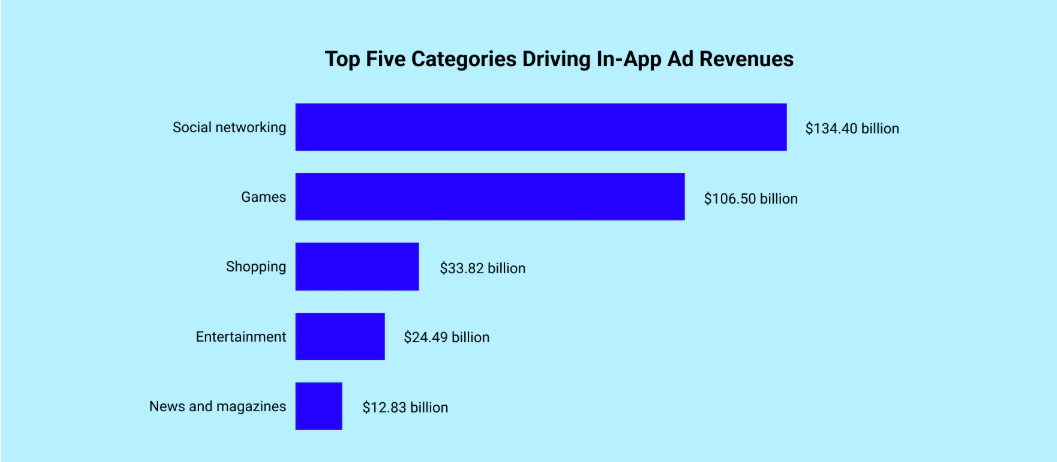
- Social networking apps generate the highest in-app advertising revenue, with games next in line. (Oberlo)
5 In-app Purchase Statistics
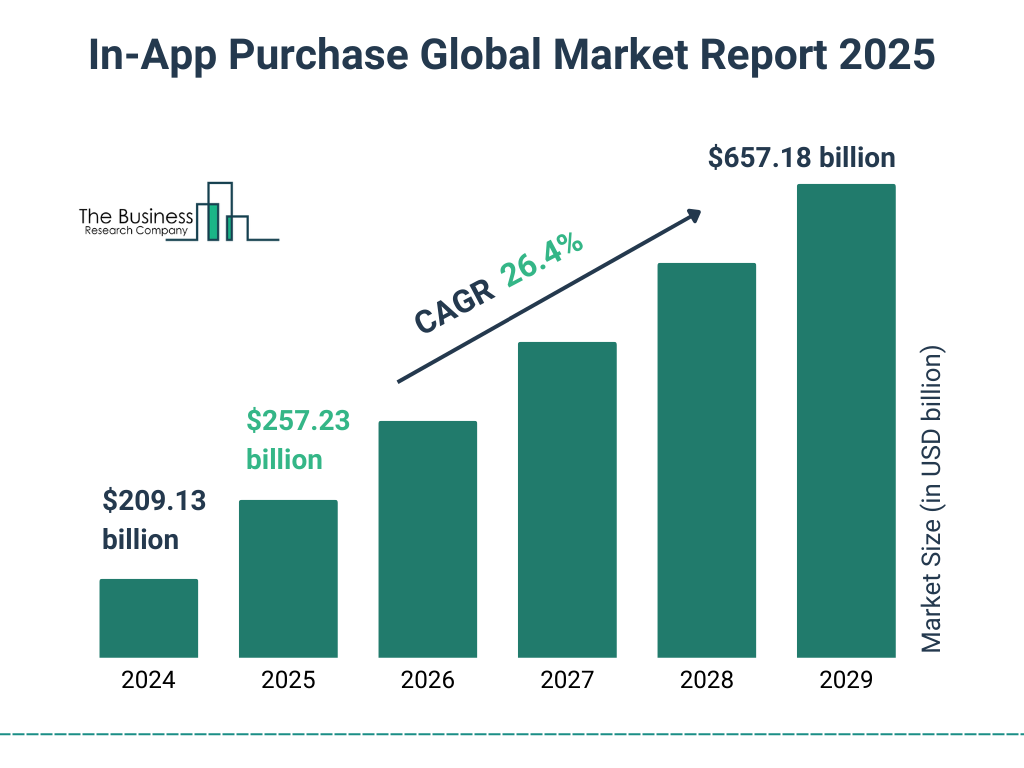
- The in-app purchase business has developed at an exponential rate in recent years. It will rise from $209.13 billion in 2024 to $257.23 billion in 2025, with a compound annual growth rate (CAGR) of 23.0%. It will reach $657.18 billion in 2029, with a compound annual growth rate (CAGR) of 26.4%. (The Business Research Company)
- The income share from in-app purchases varies by app genre, with games at 70% and social at 20%. (GitNux)
- Conversion rates can increase by up to 45% when IAPs are intelligently timed and tailored to user behavior patterns. (TyrAds)
- Revenue from in-app purchases in non-gaming apps has been significantly increasing over the last decade, rising from $3.5 billion to $69 billion. The key drivers of this expansion were apps in the Entertainment, Productivity, and Photo/Video categories. (Byyd.me)
- According to the same study, in 2024, four games, Last War, Whiteout Survival, Dungeon & Fighter, and Brawl Stars, achieved $1 billion in in-app purchase income for the first time, marking a watershed moment in the mobile gaming industry.
7 Subscription Model Statistics
- The subscription economy has risen by 435% over the previous decade. It is expected to reach $1.5 trillion in market value by 2025, demonstrating that it will continue to be a viable business model. This is due to the growing tendency of businesses transitioning from a ‘pay-per-product’ license model to a subscription business model in which customers are invoiced on a recurrent basis. (Erp.today)
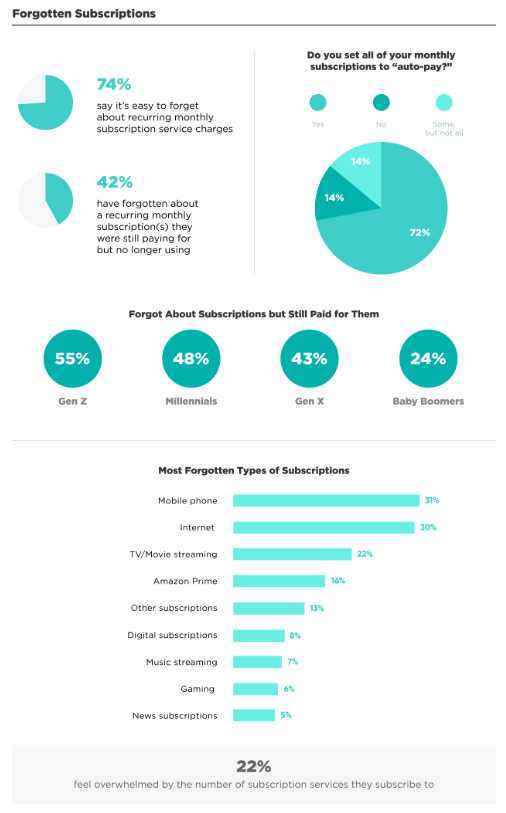
- Subscription Service Statistics and Costs research shows that the average consumer spends $219 on monthly subscriptions, which is 2.5 times the amount they thought they did. Moreover, 42% of the users still pay for subscriptions they have forgotten about or no longer use.
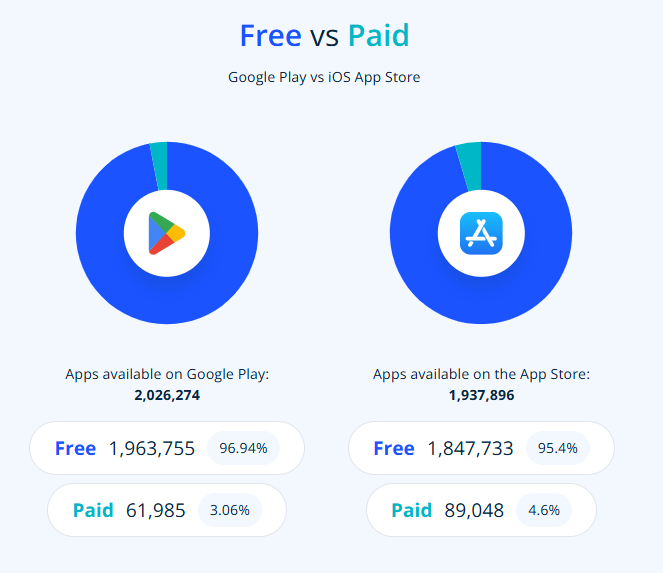
- The number of free apps on both the Google Play Store and the Apple Store has constantly surpassed the number of paid apps. As of May 2025, almost 97% of apps in the Google Play app market were free. This demonstrates that the freemium model still dominates the app market (Statista). Speaking of numbers, Google Play now has 1,963,755 free apps and 61,985 paid apps. Meanwhile, the App Store contains 1,847,733 free apps and 89,048 paid apps. (42Matters)
- Freemium apps account for more than 65% of app downloads worldwide. This is another statistic that showcases the dominance of the freemium subscription model in the market. (GitNux)
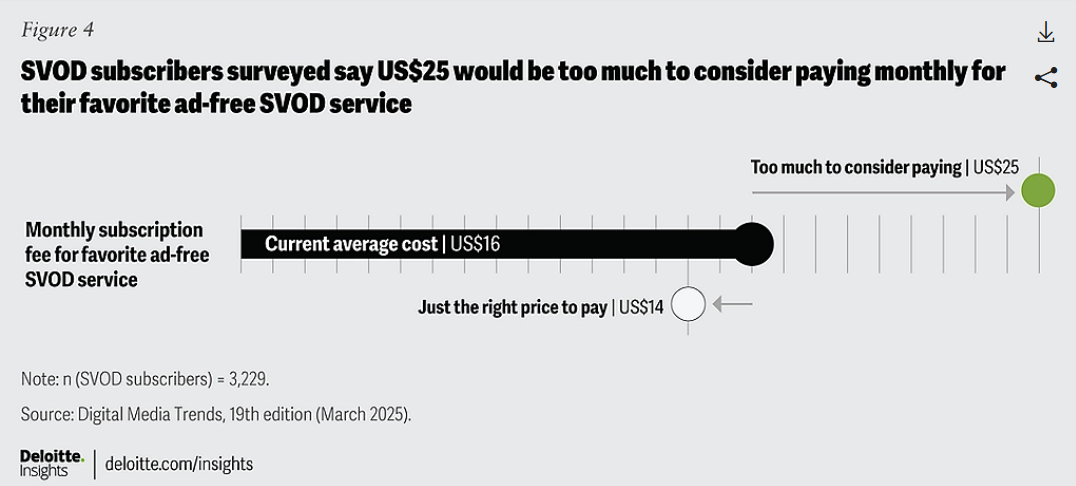
- The average monthly cost for a premium, ad-free SVOD (Subscription Video On Demand) service membership is roughly $16, though the leading providers can be much higher. However, a consumer survey showed that users feel $14 is “just the right price” for an ad-free membership to their favorite SVOD service, while $25 is deemed too pricey. (Deloitte)
- As per Design Rush, apps with an annual subscription model retain 28% of their users after a year, whereas monthly subscription models keep 12% and weekly plans keep only 3.5%.
- Apps with well-executed subscription models experience up to 50% higher lifetime value than those relying only on one-time transactions. (TyrAds)
2 App Store Optimization Statistics
- According to research from Apple Search Ads, 70% of mobile consumers use search to discover new apps. Furthermore, 65% of all downloads happen immediately following a search. This emphasizes the importance of a quality app listing with relevant keywords. (AppRadar)
- The most crucial component in increasing conversions on the Apple App Store is the number of screenshots posted. The app icon ranks second, followed by ratings. However, it’s the opposite for Google Play Store; first comes the app icon, followed by screenshots added and ratings. (AppMySite)
Conclusion on App Monetization Statistics
As the app prospects continue to ripen, app monetization strategies must keep up with the pace. For that, it becomes imperative for app publishers to make data-driven decisions. From soaring ARPU in gaming apps to the growing dominance of in-app advertising and subscriptions, 2025 is about maximizing revenue and retention.
Are you ready to optimize your app? Contact AdPushup, a Google-certified Publishing Partner, to get a personalized demo and turn insights into income.
FAQs – App Monetization Statistics
A 1000-download app may earn anywhere from $10 to $50 per month, depending on its monetization approach and user engagement. While this may appear little, it is a starting point for making money from an app.
According to statistics, just about 0.5% of consumer mobile apps are successful, and even fewer (less than 1%) earn significant money.
The app monetization market is vast and growing. Total revenue is expected to show an annual growth rate (CAGR 2022-2029) of 7.48%, resulting in a projected market volume of US$781.70bn by 2029. (Statista)
With average revenue per user touching $64.26 by 2027, gaming apps are deemed the most profitable category to invest in. (Adapty)
While predicting the average revenue from advertising as a whole can be difficult, we can break it down based on impressions. The average revenue per thousand ad impressions varies significantly around the world, ranging from $0.05 to more than $20, depending on the type of advertisement.
Banner ads typically generate the lowest revenue, ranging from $0.05 to $0.91. Interstitial ads produce greater results, ranging from $0.85 to $15.30. However, rewarded video ads is the most successful ad format, with earnings ranging from $0.85 to $21.20 per thousand impressions. (Syndicode)
Google does not compensate developers depending on the amount of app downloads if the app is free. When a user downloads a paid app, they must pay money first. In such apps, Google retains 30% of the app download cost while giving the remaining 70% to the developers.
There is no definitive statistic because a lot depends on the app category. A fair baseline for basic viability may be 10,000+ monthly active users for consumer apps or 500-1,000 for commercial apps. For gaming apps, 50,000 or more monthly downloads are frequently considered a sign of profitability.