
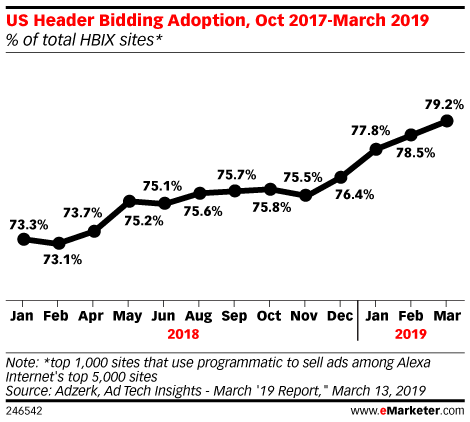
In a recent research we conducted, we found that 78% of the top 50 largest digital publishers in the world (by traffic) were using header bidding. Apart from IAB’s ads.txt spec, no other sell-side technology has enjoyed the kind of rapid adoption that header bidding has in recent years.
There’s a good reason for that.
Header bidding has allowed publishers to greatly increase their programmatic ad revenue. On average, we see publisher revenues jump by 30-40% once they start using header bidding, with the uplift being even higher in individual cases. Case in point: Header bidding helped The Telegraph increase its programmatic revenue by 70%.
More revenue is one aspect of what makes header bidding so popular with publishers, the other is direct and transparent access to reporting data, at least in the case of client-side header bidding.
Want to know more about Header Bidding? Click here.
Key Metrics Used in Header Bidding Analytics
In order to understand header bidding reports, publishers need to have a good grasp of the terminology used in those reports. Here are some of the most common metrics provided by header bidding analytics tools.
1. Bid rate
Bid rate signifies how often a bidder makes a bid in response to an ad request. Based on the website audience and the bidder used, bid rate can vary anywhere between 20% to 80%. A low bid rate might indicate a configuration problem with your setup or bidder performance issues, i.e., bidder is too slow to respond or does not have relevant ads for your audience. The overall bid rate directly impacts the competition inside your wrapper and the overall fill rate.
2. Win rate
Win rate shows how a particular bidder competes with others in the header bidding auction. A high bid rate would mean nothing is the bidder never actually wins the auction. The win rate of a bidder depends on a lot of factors including their pool of advertiser demand, website cookie match rate, and the overall demand for the publisher’s inventory. Together, the bid rate and win rate can indicate how efficient a particular bidder is. (Total Efficiency=Bid Rate*Win Rate)
3. Timeout Rate
When a bidder fails to return a bid within the timeout limit specific by the publisher’s wrapper—the bid is said to have “timed out”. Timeout rate indicates how often a bidder times out during an auction. When viewed along with bid rate and win rate, timeout rate can help publishers understand the opportunity/cost of retaining a particular bidder. Bidders with a consistently high timeout rate harm the site’s UX and the publisher’s revenue generating ability.
4. Bid Latency Report
For bids that don’t time out, the time taken for the bid request to complete is denoted by latency. Latency by bidder report allows publishers to view bidders based on how fast or slow they are on average. Bidders with high average bid latency can create bottlenecks for your header bidding auction, since the auction closes with the slowest bid before the timeout kicks in.
5. Discrepancy Report
Discrepancy is a mismatch between the publisher’s reporting and the bidder’s reporting. There are multiple ways in which header bidding latency can manifest. In one scenario, the header bidder selects an ad, DFP returns the selection ad, but for some reason–the ad is either not served or not detected by the demand partner as being served. There may also be quality/viewability filters used at the buy-side that the publisher is not familiar with, which disqualify a particular ad that the publisher considers served. Too much discrepancy can create payment delays and big differences in expected and received revenue. This report can help publishers identify instances of discrepancy, so that they can resolve them in a timely manner.
6. CPM Report
CPM means cost-per-mille and for the publishers, signifies the revenue generated for every 1000 ad impressions sold. CPM is a standard advertising metric that is used widely in reporting and also applies to header bidding auctions. Publishers who are considered to have a premium inventory, i.e., well-defined audience segments, brand safe environment, high demand, are often able to garner relatively high CPMs in header bidding auctions.
7. Revenue Report
This is the overall revenue that a publisher has generated. As with CPM reports, most header bidding analytics tools allow publishers to view revenue by bidder, channels (client-side, Open Bidding, tag-based), geography, ad size, and device type, among other dimensions—filtered by custom date ranges. It is important to consider whether the header bidding analytics tool you’re opting for gives you such granular reports.
How to Use Header Bidding Analytics to Optimize Your Stack
Having access to header bidding analytics is one thing, but how can publishers use the reporting data to drive optimizations in their ad stack? Here are some ideas.
1. Selecting Demand Partners
The choice of selecting demand partners is an important one. Adding too many bidders to your wrapper will send your average latency and timeouts soaring, on the other hand, having too few may lead to low bid competition for your inventory. To keep latency in check, it is recommended to keep the total number of bidders on your website under 10. Most publishers configure somewhere between 4 to 6 partners, we recommend starting with 4 and then adding partners until you hit the sweet spot between UX and bid competition. Publishers can further optimize the demand partner mix by dropping those who consistently return low bid rates and win rates, while scoring high on timeout rates and average latency.
2. Setting Optimal Timeouts
Most header bidding wrappers allow publishers to set custom timeouts, which is the upper time limit for auctions—meaning, the auction will close regardless of whether or not all participating bidders have returned a bid. Timeouts help publishers strike a balance between page latency and ad revenue. An aggressive timeout would be around 500-600ms, this timeout favours page speed and user experience above everything else including ad revenue, as many potential bids will get timed out. If you want to fine-tune timeouts for maximizing revenue, try setting 1300-1500ms as your timeout. Once you’ve configured your demand partners, monitoring the timeout rate, bid latency, and average page load speeds will give you the information you need to adjust timeouts accordingly.
3. Improving Geographic Performance
All bidders are not created equal. Demand partners typically specialize in one or two geographies, based on where most of their advertiser demand is concentrated. By slicing the CPM and revenue reports by different geographies, publishers can discover which demand partners in their header bidding stack are delivering better results for particular geographies. If most of your traffic comes from a specific geography, you may want to select partners who have a history of delivering the best win rate, CPM, and revenue for that region. On the other hand, if your traffic sources are diverse, you’ll want to make sure that your mix includes bidders who specialize in multiple geographies that are represented by your traffic.
4. Fine-tuning Content Strategy & Traffic Sources
Category and page-level reports can help publishers identify the content themes, sections, and individual pages that have the greatest revenue contribution. Using these insights to plan future content can help create a positive feedback loop between your content strategy and ad revenue. For publishers who buy their traffic from other sources, the CPM and revenue report filtered by referral sources can help identify the most profitable acquisition channels. For instance, if you discover that traffic from Twitter consistently delivers higher CPMs and revenue when compared to traffic from Reddit, you will want to increase your spend and engagement on Twitter. For publishers who primarily rely on organic traffic, the referral sources report can present opportunities for link building with websites that are sending them high-quality traffic.
5. Leveraging Unified Reporting
Some header bidding tools that provide GAM integration and automation features also provide analytics dashboards that present a consolidated view of header bidding auction report and performance reports related to Google Ad Manager channels, advertisers, line items, and orders. By bringing together all revenue channels in one place, this consolidated view makes it easier for publishers to know their true source of revenue and make decisions accordingly about how to best segment and sell their inventory based on individual channel’s performance and revenue contribution. This is not a standard feature however, and only offered by a few vendors.
Conclusion
While even the most basic header bidding stack will help publishers grow their revenue over the baseline, there is a lot of scope for optimization after the initial setup has been configured.
In order to make the most of header bidding and maximise their revenue, publishers need to become familiar with the key performance metrics related to header bidding, and use them to make continuous optimizations to their website, demand partner mix, and auction settings—that is what marks the difference between good and great revenue growth.
AdPushup’s Header Bidding Solution
Merely deploying header bidding in your ad stack isn’t enough. Consistently optimizing it with technical improvements is the need of the hour. This is what AdPushup’s header bidding solution does. Through our multiple optimization features using data science and machine learning, we help publishers maximize their yield.
With our header bidding solution, you get:
- Automatic demand partner selection according to optimum requirements
- Smart timeout management
- Freedom to bring your own demand
- Bid monitoring and discrepancy resolution
Read more about our product capability: Header Bidding

Shubham is a digital marketer with rich experience working in the advertisement technology industry. He has vast experience in the programmatic industry, driving business strategy and scaling functions including but not limited to growth and marketing, Operations, process optimization, and Sales.


")

