
We all can agree — ad ops personnel spend most of their time working on reports. For some individuals, generating and evaluating ad reports are a part of their daily tasks. These reports can be a holistic inventory-wide ad performance or last month’s CTR on a specific ad unit, and others.
Generally, reporting parameters depend on your company targets and your client requirements. However, one thing remains constant — generating them without error. This is where Google Ad Manager shines out in the ad industry. It offers an advanced reporting panel with minimum discrepancy. Furthermore, users are allowed to create and schedule reports as per their convenience.
For beginners, Google Ad Manager reporting can look a bit overwhelming. In this post, we have covered all the basics and must-knows to generate a report in GAM.
Google Ad Manager Reporting
With Google Ad Manager, you can create reports of every service and task managed on the platform — demand partners, yield partners, AdSense, Ad Exchange, and other linked services.
The reports can be scheduled by day, week, and month. GAM allows filters based on dimensions and metrics. And if you are new to GAM reporting, you can start with predefined templates. Once these reports are generated, you can share them with your team within the dashboard or save as CSV or Excel files.
What are report dimensions and metrics?
In Google Ad Manager, reports are customized based on the dimensions and metrics. Dimensions are elements used by your ad server, network, and exchange (like programmatic deal types, ad units, advertiser verticals, etc.). And metrics are used to measure a dimension (like CTR, Active View, etc.).

How to Create a Report in Google Ad Manager
GAM has recently updated its reporting panel. Earlier it had a ‘Queries’ section under ‘Reports’. The ‘Queries’ subsection is removed and merged into ‘Reports’. Here’s is how you can create report with the updated panel:
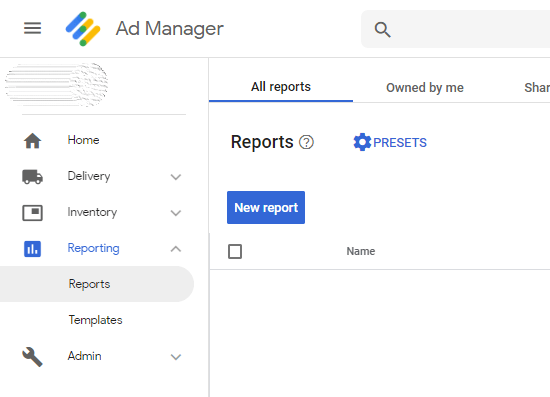
- On your Google Ad Manager dashboard, scroll down to ‘Reporting’ in the left menu bar.
- Click Reporting > Reports > New Reports.
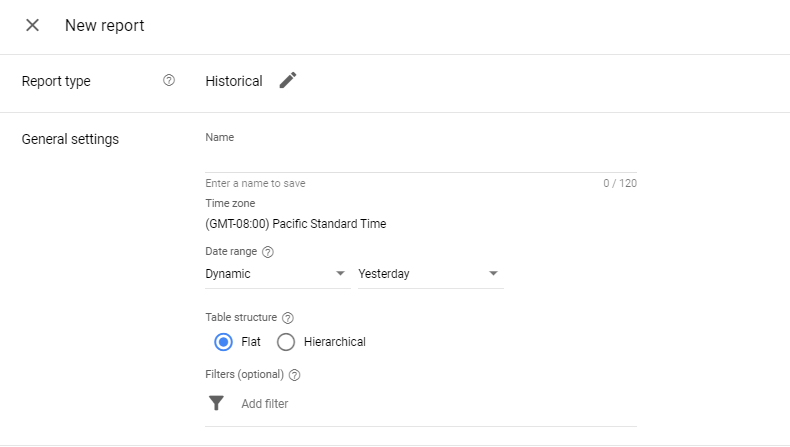
- Give your report an appropriate name.
- Select the report type from the following:
- Historical: Historical data related to click, impressions, and revenue
- Ad speed: Time spend to process ad request through Ad Manager and other properties (like Ad Exchange)
- Ad Exchange historical: Create and edit Ad Exchange report from within Ad Manager
- Future sell-through: Uses historical data to forecast future sell-through rate by evaluating impressions, clicks, and reserved inventory
- Partner finance: Advanced financial report to track performance of various partners
- Reach: Identify the number of unique users exposed to specific advertiser, order, line item, or ad unit for a given time span.
- Select the time zone for the report, Pacific Standard Time (GMT-08:00) is the default time zone in GAM.
- Choose a date range: Dynamic (ideal for scheduled reports), Custom, or Fixed.
- Select structure for your report:
- Flat table: A simple spreadsheet view with rows and columns.
- Hierarchical table: A table view with each dimension having aggregated data within. For instance, ad unit size 720×90 could have country-wise impressions.
- Filter the report result (optional). Filters can be added based on boolean logic (AND, OR, NOT) and applied to ad units, targeting, key-values, yield partner, and more.
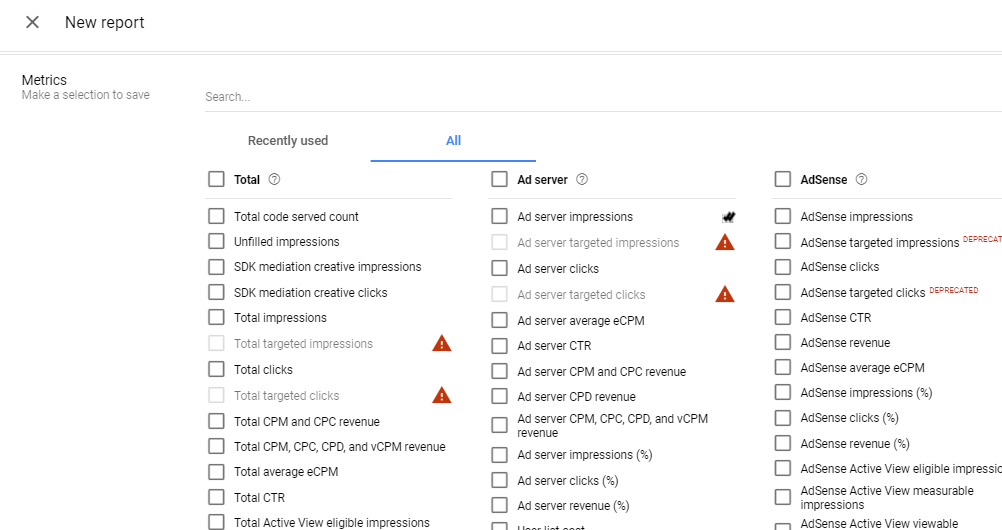
- Now select the report dimensions (can select up 10) and metrics.
- If you wish to share the report with other users, then add their email addresses under the Editors section.
- And choose whether you wish to schedule this report (daily, weekly, and monthly) and make it for one-time use (unscheduled).
- Save and run the report. Or you just save it for now and run later.
It can take a while to generate the report. Once it’s done, you can see it under ‘Reports’ and download it.
Use Predefined Template to Generate Reports
Templates (previously, System Queries) are built-in criteria and filters that help you generate quick reports. You can find it under Reporting > Templates.
These are some available templates, their dimensions and metrics:
| Name | Date range | Dimensions | Metrics |
|---|---|---|---|
| Currently running campaign report (all under an advertiser) | Yesterday | – Advertiser – Order – Line item | – Total impressions – Total clicks – Total CPM and CPC revenue – Total average eCPM – Total CTR |
| Currently running campaign report (all under an order) | Yesterday | – Order – Line item – Creative | – Total impressions – Total clicks – Total CPM and CPC revenue – Total average eCPM – Total CTR |
| Creatives report | Last month | – Advertiser – Creative | – Total impressions – Total clicks – Total CTR |
| Monthly network performance report | Last month | – Month and year | – Total impressions – Total CPM, CPC, CPD, and vCPM revenue – Ad server impressions – Ad server CPM, CPC, CPD, and vCPM revenue – AdSense impressions – AdSense revenue – Ad Exchange impressions – Ad Exchange revenue |
| Daily network performance report | Last month | – Date | – Total impressions – Total CPM, CPC, CPD, and vCPM revenue – Ad server impressions – Ad server CPM, CPC, CPD, and vCPM revenue – AdSense impressions – AdSense revenue – Ad Exchange impressions – Ad Exchange revenue |
| Network geography report | Last month | – Country | – Total impressions – Total CPM, CPC, CPD, and vCPM revenue – Ad server impressions – Ad server CPM, CPC, CPD, and vCPM revenue – AdSense impressions – AdSense revenue – Ad Exchange impressions – Ad Exchange revenue |
| Monthly ad unit report | Last month | – Ad unit (top level) | – Total impressions – Total CPM, CPC, CPD, and vCPM revenue – Ad server impressions – Ad server CPM, CPC, CPD, and vCPM revenue – AdSense impressions – AdSense revenue – Ad Exchange impressions – Ad Exchange revenue |
| Monthly placements report | Last month | – Placement | – Total impressions – Total CPM, CPC, CPD, and vCPM revenue – Ad server impressions – Ad server CPM, CPC, CPD, and vCPM revenue – AdSense impressions – AdSense revenue – Ad Exchange impressions – Ad Exchange revenue |
| Remnant report | Last month | – Date | – AdSense impressions – AdSense clicks – AdSense CTR – AdSense average eCPM – AdSense revenue – Ad Exchange impressions – Ad Exchange clicks – Ad Exchange CTR – Ad Exchange average eCPM – Ad Exchange revenue |
| Device and browser report | Last month | – Targeting | – Ad server impressions – Ad server CPM and CPC revenue – AdSense impressions – AdSense revenue – Ad Exchange impressions – Ad Exchange revenue – Total impressions – Total CPM and CPC revenue |
| Billing report | Last month | – Order | – Total impressions |
| Downloaded impressions | Last 7 days | – Date- Inventory types – Device category – Ad unit (top level)Request type | – Ad server impressions |
| Safari Browser Report | Last 7 days | – Demand channelTargeting | – Total impressions – Total clicks – Total CPM and CPC revenue – Total average eCPM – Total CTR – Total Active View viewable impressions – Total Active View % viewable impressions |
| Estimated Ad Exchange revenue | Last 7 days | – Date | – Ad Exchange impressions – Ad Exchange revenue |
In Closing
With so many filters and metrics, GAM reports may seem tricky at first. But once you get started, it should become an essential service for your daily ad operations.
For better reports, it is advised to link your Google Analytics with GAM. This syncs ad-level and site-level data for better performance tracking.
You can try the Skillshop training course offered by Google to get started with the basics of Google Ad Manager.

Shubham is a digital marketer with rich experience working in the advertisement technology industry. He has vast experience in the programmatic industry, driving business strategy and scaling functions including but not limited to growth and marketing, Operations, process optimization, and Sales.