
If you can’t measure something, you can’t understand it. If you can’t understand it, you can’t control it. If you can’t control it, you can’t improve it. ― H. James Harrington
Quick question: How much effort do you put into creating high-quality media for your website?
Don’t answer that, it’s rhetorical. I know you put in all the effort that you can; any serious publisher does, it’s otherwise not possible to survive on the hyper-competitive web.
Now, for a non-rhetorical question: Do you measure user engagement on your website?
Sure, you have Google Analytics installed, but how does that give you any special insight over anyone else?
Don’t get me wrong, Analytics is a great tool, depending on your knowledge—you can do some amazing things with it, but you can’t do everything.
You can’t accurately track time-on-site (most commonly used web analytics tools let you do it but it’s not precise), scroll depth, user attention zones and many other such intelligent metrics that will get you thinking less of the ‘click web’ and more of ‘attention web’.
But wait…
What is the ‘attention web’?
Attention web is a set of ideas and concepts that mark a shift in mindset when it comes to measuring user engagement on the web; spurred in parts by independent web developers, industry thought leaders, and specialist publishing and ad ops teams at large publications such as Upworthy, Medium, and BuzzFeed.
Medium uses a self-defined metric to measure success, as explained by the CEO, Ev Williams.
Internally, our top-line metric is “TTR,” which stands for total time reading. It’s an imperfect measure of time people spend on story pages. We think this is a better estimate of whether people are actually getting value out of Medium. By TTR, last week was still big, but we had 50% more TTR during a week in early October when we had 60% as many unique visitors (i.e., there was way more actual reading per visit).
Ev is far from the only person who understands that our current means of measuring engagement are not evolved enough to tackle the modern web.
Nick Rockwell, CTO, NYTimes, recently made the following observation:
Focusing on clicks would be a terrible mistake for us. We know from the data that the cycle for a reader to grow to understand the Times and eventually become a subscriber is measured over many years. Sometimes as long as a decade. The signal that you get from just looking at clicks is not going to be significant enough. We haven’t landed on what we think the perfect formula is. Amongst the things we care about are what people click on, the time they spend with a particular piece of content, scroll depth, as well as repeat visits over a defined period of time. Those are some of the key metrics.
So, what can you track about your users that will give you beyond-the-basics data and insights, and how?
Here are a few tools that you can set up and start using now.
1. The Parsnip.io Bundle
Track deep engagement metrics
A set of three open-source user engagement tools created by Rob Flaherty, a digital product consultant from New York. These tools allow you to measure things like how deep users are scrolling your page, how much time they’re spending on your website and on which sections.
Scroll Depth
Scroll Depth is a small Google Analytics plugin that lets you measure how far users are scrolling. It monitors the 25%, 50%, 75%, and 100% scroll points, sending a Google Analytics Event for each one. The plugin provides native support for Universal Analytics, Classic Google Analytics, and Google Tag Manager, and can be used with any analytics service that supports events.
Screen Time
Screentime is a small tool that helps you start thinking of your website traffic in terms of time instead of hits (pageviews, visits, etc). You can define areas of the page, called Fields, and then Screentime will keep track of how much time each Field is on screen for. You can also use it to track smaller elements, like ad units.
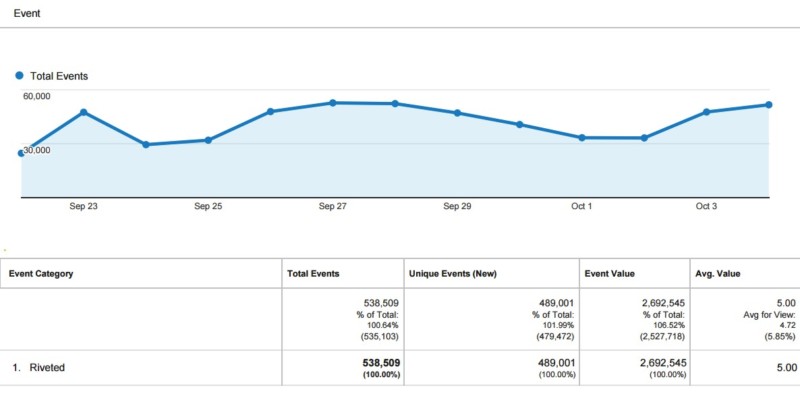
Riveted
Google Analytics does a lot of things really well but the way it measures visit duration—by calculating the time difference between pageviews—provides only a partial view of how much time is actually spent on site. Riveted helps fix this by measuring the amount of time users are actively engaged (e.g., clicking, scrolling, using the keyboard) and then reporting the data to Google Analytics in frequent intervals.
2. Heatmaps and Clicktracking Tools
Visualize your user activity
Wouldn’t it be nice to see an sum of all activity that’s happening on your website in a visual way?
Heatmapping and clicktracking tools help you do just that by allowing you to gain valuable insight into the way that visitors interact with your site.
These tools answer the following questions:
- Where do visitors click?
- How much are visitors scrolling on the page?
- What actions can I optimize to increase conversions?
These tools are meant to give you an inside look into how your visitors interact with your website. Design and content additions can then be formulated to increase or optimize user behavior on the site. There is no more “guesswork” – just factual data based on user behavior.
Some of the most popular tools in this category include SumoMe, CrazyEgg, Lucky Orange, ClickTale, Inspectlet, SessionCam, me, Mouseflow, HotJar, and Seevolution. You can find a reviews of some of the best heatmap and clicktracking tools here.
3. Mixpanel
Identify gaps in your conversion funnels
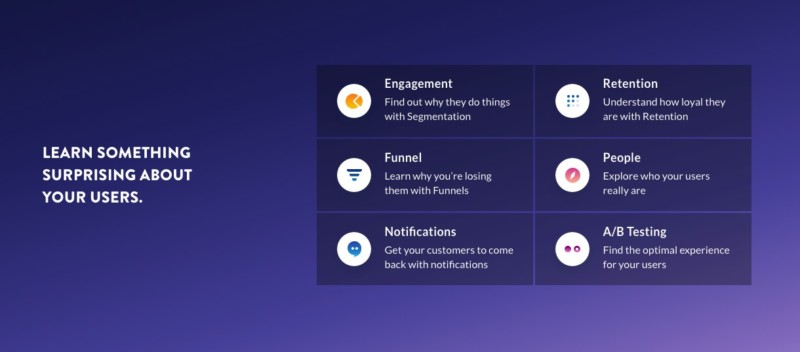
Though Google Analytics allow you to measure conversion goals, the way that data is presented is not really too intuitive — in most cases, if you want to visualize a conversion funnel, you will need to pull the data and process it using another data processing tool such as Excel or Sheets. Mixpanel fixes this by providing multiple ways of visualising the conversion data on your website.
In essence, instead of tracking page views, Mixpanel allows you to define and track multiple ‘user actions’ on your website and mobile apps.
At AdPushup, we use Mixpanel to track multiple user actions across our site; on our blog, we use it to measure user conversion from when they first land on a page to the product sign up, this involves tracking conversion rates at three distinct steps:
- Visitor > Sign Up Page (visitor went to sign up page)
- Sign Up Page > Thank You Page (visitor signed up successfully)
- Thank You Page > Saved Site (visitor saved their site in our visual editor)
While looking at these numbers, we realized that the conversion rate at step (1) was dismal compared to that of the other two steps — now we knew that we need add more noticeable call-to-actions on our blog to direct the users to the app Sign Up Page.
This is the kind of useful information you can find out using Mixpanel, it doesn’t matter what your goal is — product sign up, book download, completed purchase, you can define and track all the steps that lead up to the final conversion, and find bottlenecks holding back the entire cycle.
4. Chartbeat
Forget page views; measure attention instead
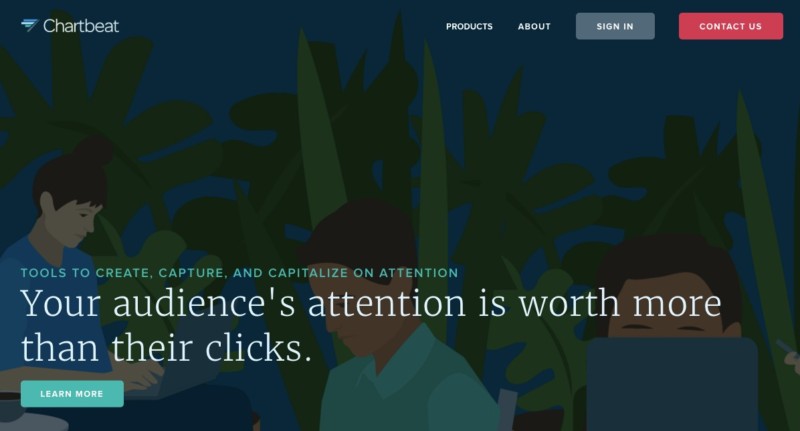
One of the pioneers of the “attention web” concept — Chartbeat allows publishers, brands, and agencies to measure and monetize user attention. Admittedly, their requirements are high and you need to meet some predefined minimum traffic criterion.
If you do get in though, this is what Chartbeat can help you do:
- Track and measure the second-by-second attention of your users
- Adapt and capitalize on the content that’s resonating with your audience
- Drive the right readers to the most engaging content again and again
How does it help you with this? By providing a whole suite of audience building tools including:
- Real-time analytics
- Audience insights
- Page optimization
- Headline testing
- Performance benchmarking
- Report building
As you may imagine, these tools can really help you optimize and bump up the attention levels that your content is currently attracting.
Just in case you don’t make the cut, you can sign up for their base plan which is available to everyone for $9.95 / month; it’s intended for small blogs and can help you with insights such as real-time concurrent visits, engaged time, desktop / mobile traffic split, social activity, page load times, top pages, and traffic sources — all this on one sleek dashboard.
5. KISSMetrics
Track, analyze, and engage your audience
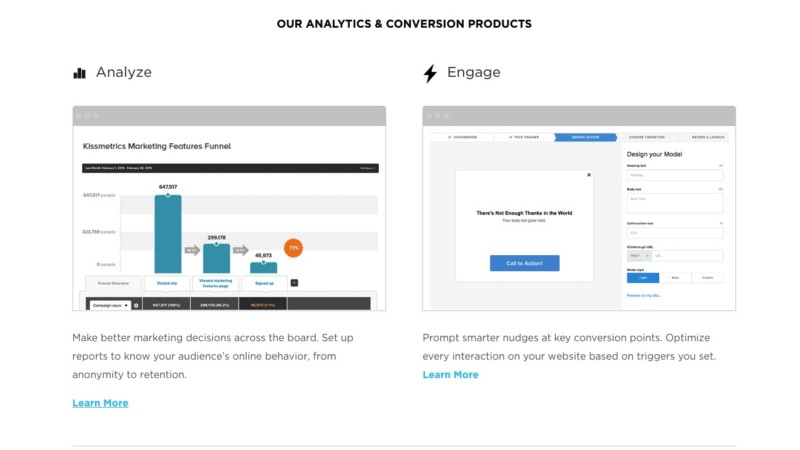
Founded by Neil Patel (who is more commonly recognized as a prolific blogger in the marketing growth industry), KISSMetrics helps publishers and marketers measure user behavior analytics to drive growth — helping turn visitors into customers.
KISSMetrics offers tools under two categories: (1) Analyze and (2) Engage.
With Analyze, you can track individual and group visitor behavior from their very first visit to your website and identifying their lifetime value as a customer.
‘Analyze’ offers 7 reports:
- Funnel Report (where are visitors dropping out?)
- Cohort Report (which marketing activities lead to the highest signup rates?)
- Path Report (micro-analysis of user journey)
- People Search (searching users by criteria)
- A/B Test Measurement (how are they impacting the final revenue?)
- Revenue Report (where is your money best spent?)
In Engage, the second set of tools offered by KISSMetrics, you can engage users based on the information collected with the first set of tools. Think of them as a more intelligent breed of call-to-actions that work based on collected user data.
With the ‘Engage’ set of tools, you can:
- Show a newsletter sign up to new visitors only
- Greet a campaign audience with a unique message
- Provider a special offer to a user abandoning your shopping cart
These are just a few examples of what you can do with the audience segmentation, behavioral targeting, and design tools provided by KISSMetrics to engage your audience.
6. Qualaroo
Qualitative analysis for user engagement
No matter how good an analytics software, numbers will never be able to tell you the complete truth about what your users think; even if you manage to arrive at at some roundabout conclusion, you’re going to have to work hard to extract the signal from the noise.
So while analytics tools and quantitative analysis have their place in your marketing stack, sometimes, you just need a user to tell you:
“Hey, I don’t like the drop shadow on your navigation bar, it looks kind of tacky…’.
These are things you will never get from numbers.
That’s where Qualaroo comes in, combining the best of analytics-based user targeting and user survey platforms, Qualaroo allows you to target specific questions to your visitors anywhere on your website — whether that may be on their first interaction with your site or some point deep within the conversion funnel. Think of it as an exceptionally smart survey tool.
By using Qualaroo, you can:
- Improve conversion rates (by acting on real user feedback)
- Eliminate hidden roadblocks (by removing elements that may be annoying visitors)
- Add context to analytics (by getting to the “why” behind your analytics data)
A few features of Qualaroo include:
- Question targeting (based on multiple criteria)
- Exit surveys (triggered at user page abandonment)
- Skip logic (unique follow-up questions based on earlier responses)
- Question library (so you don’t have to do all the thinking)
- Quick setup (just takes a few minutes)
- White label (add your logo and change the colour to blend the design in)
So if you’re perplexed with all the hundreds of charts and graphs that analytics tools tend to throw in your face — and want some real user feedback — Qualaroo is worth a shot.
Next Steps…
What to do now that you know all this
These are a few tools that you can use to gain a deeper understanding of your user journeys from the moment a visitor first lands on your page to the one where they close the tab.
My advice? These are some pretty powerful tools and may seem overwhelming if you try to implement all of them in one go; besides, you probably just need one or two of them based on your current goals, a good place to start is by asking yourself the following question:
‘What do I want to measure right now?’

Shubham is a digital marketer with rich experience working in the advertisement technology industry. He has vast experience in the programmatic industry, driving business strategy and scaling functions including but not limited to growth and marketing, Operations, process optimization, and Sales.