Seasonality trends are common and predictable patterns. They occur during the same weeks every year & help publishers with revenue optimization. In this blog, we delve deeper into seasonality trends, break down each quarter, and understand effective strategies for publishers to increase their revenue.
Seasonality trends impact publishers throughout the year, irrespective of industry.
The ideal way to optimize ad revenue is to pay attention to all such factors and optimize your website accordingly.
As a publisher, you might have noticed that your revenue increases or decreases noticeably during some months. This is due to publisher trends in ad revenue, recession, and more.
While publishers may not be able to control the onset of seasonality effects, they can definitely optimize ad revenue to some extent. Thus, publishers need to keep a watchful eye on the seasonality trends.
To help publishers cope with these fluctuations, we have curated this blog to help publishers understand seasonal trends in terms of revenue and preventive measures that they can take.
Let’s start with the recession first.
How Recession or Economic Downturn Affect Publishers?
During the economic downturn, publishers may experience various trials and tribulations as such times only exacerbate the challenges experienced by the industry. Why? Because during such times consumers tend to tighten their budgets. And since they reduce their spending on non-essentials, advertisers start to discontinue their advertising efforts. Thus, publishers end up with decreased ad revenue.
Apart from that, certain sensitive industries experience much more difficulties in the economic downturn. These include travel & tourism, hospitality, and more. These industries completely cut back on their advertising budget during the recession, which leads to a further decline in publishers’ revenue.
Apart from ad revenue, a recession can hit publishers in terms of content consumption as well. For example, during holidays, there is generally more demand for certain festive activities, gift guides, seasonal recipes, travel-related guides, and more. However, during the recession, people will be less likely to search for this type of content and will be more focused on essential information.
Now let’s dig deeper and learn what causes the seasonal fluctuations.
What Causes Seasonal Fluctuations?
According to Google,
seasonality is any predictable fluctuation or pattern that occurs during the same weeks each year.
For instance, many publishers may have noticed their CPMs increase during the holiday season. This could be the time near Christmas for countries such as the U.S. and the U.K. or the time near Diwali in India.
Seasonality driven by holidays mostly comes under the cultural aspect. Other than this, publishers may have also witnessed high CPMs because of commercial aspects, including the end of the season and Black Friday sales.
So, what exactly happens when such events take place?
Firstly, advertisers spend more money on their campaigns. Secondly, the number of users on websites, including e-commerce and social media, increases. Both factors allow publishers to earn higher revenue than they normally do. With the help of revenue recognition software, publishers can more precisely track when seasonal peaks in revenue occur and align their monetization strategies accordingly.
The year 2020 especially witnessed a significant rise in online consumers because of COVID. As per eMarketer, consumers in the U.S. were estimated to spend $190.47 billion on holiday eCommerce purchases in 2020. This was a whopping $50 billion more than 2019’s spending.
No doubt, publishers benefit considerably from such ad tech trends as they can serve more ads to a wider audience.
Similarly, publishers may notice decreased traffic and get lesser deals during months like January and July. This occurs because of the drop in ad spending, as advertisers are engaged in planning activities. The user behaviour witnesses also change because they return to a relatively normal routine.
Such seasonal patterns may affect publishers to a large extent. But with some strategic planning, the damage can definitely be minimized.
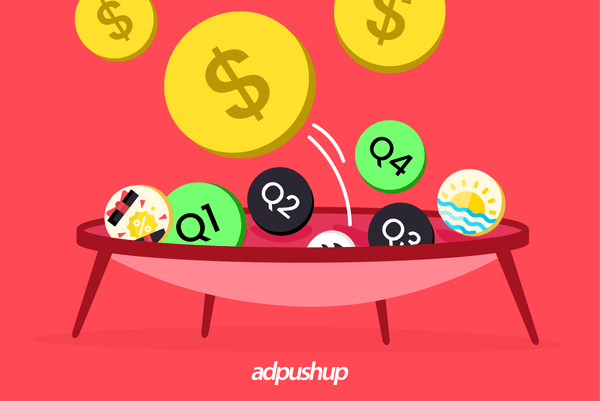
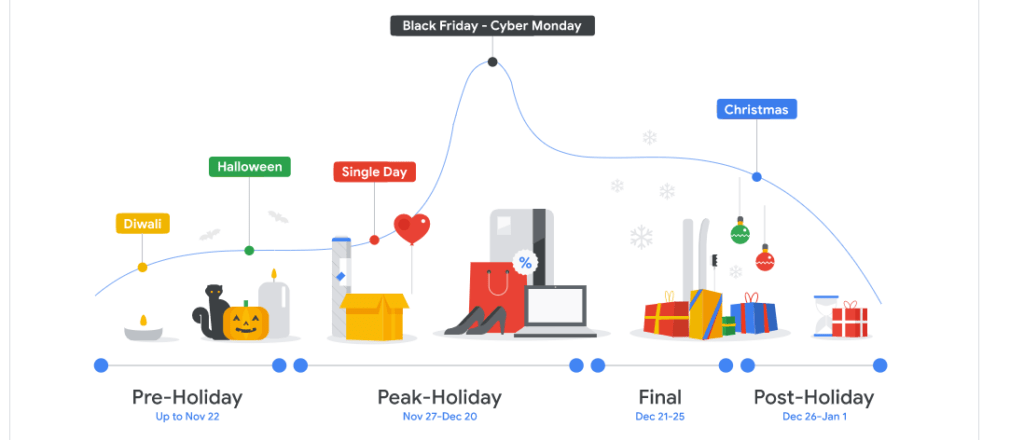
Quarter Wise Breakdown of Seasonality Trends
A lot of companies divide their year into 4 quarters: Q1 (January to March), Q2 (April to June), Q3 (July to September), and Q4 (October to December).
The following points focus on providing publishers with knowledge about what they can expect during these different quarters. This will further help them to leverage publisher trends.
Q1 January, February, March
Most publishers might be familiar with the term January slump. During the first quarter, advertisers are mostly focusing on devising new strategies for the year and, therefore, spend less money on ad campaigns.
Moreover, the purchasing behaviour of users changes widely as well in January. They are less keen on buying things after the shopping spree for Thanksgiving, Christmas, and New Year.
Q2 April, May, June
This quarter is much better in terms of revenue generation for publishers. Since advertisers start spending their budgets on different campaigns and focus on experiments as well – all of which result in better revenue for publishers.
Q3 July, August, September
Even though the July slump is not as bad as the January slump, it is a slump nonetheless. The two major factors leading to this decline is decrease in traffic and advertisers readjusting their budgets. While the change in traffic depends on the niche of the publishers, advertisers rethinking their budgets impact everyone.
Q4 October, November, December
Last but definitely not least, Q4 is probably the best quarter for all publishers. The end of the year witnesses a surge in online users due to the high number of cultural holidays that fall during this time. Because of this, brands spend extravagantly on their ad campaigns. Publishers can leverage this and earn high revenue during this quarter.
The Jotform Affiliate Program offers a generous recurring commission structure, a dedicated partner dashboard, marketing materials, and a dedicated account manager who focuses on your success. The commission rates start at 30% and can be increased up to 50% depending on your performance.
Speaking of Q4, we’re currently offering publishers an exclusive, limited-time opportunity to publishers.
Guaranteed Q4 Earnings with 15 Days of 0 Revenue Share
When you switch to us, we’ll match your current earnings and forecasted Q4 monthly revenue. On top of that, we will waive all revenue share for the first 15 days.
Sign up today, and let us help you hit your Q4 revenue peak.
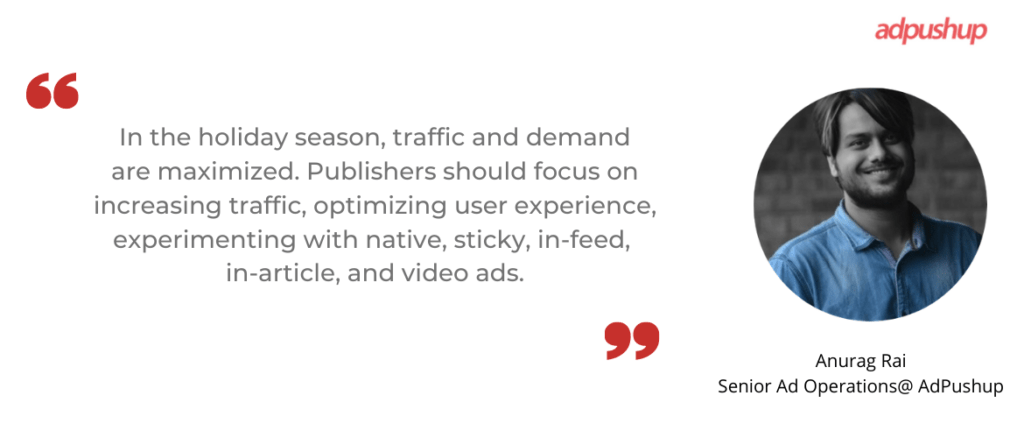
Tips for Optimizing Revenue Generation According to Seasonality Trends
Now we will talk about how publishers can maximize their revenue when their inventories are in high demand and what measures they can take to stabilize their earnings when demand is low.
Q1
The earnings in this quarter are mostly low, which is nothing to worry about. But you can take the following steps to ensure your revenue doesn’t drop too much and prepare for the rest of the year.
- First and foremost, you should focus on optimizing your inventory. Consider experimenting with different ad units, ad placements, and ad formats. You should keep up with all the innovative ad sizes and layouts that you have at your disposal and, if possible, use them to add value to your inventory.
- Remember that quality content is always an important part of websites. So, it is not advisable to put less emphasis on it, even if the traffic on your site is low. By prioritizing content you are essentially giving users an incentive to spend more time on your website and increasing engagement. This will further ensure that your site ranks better in the coming months.
- Content quality is one part of enhancing SEO for websites. Other than this, you should continuously keep a check on website health and keyword optimization. You can also consult ad ops professionals, as they can effectively monitor your website.
- Opting for private marketplace deals can be a good solution for this quarter, since programmatic auctions may not give you the desired results. PMP deals give you more control and increase the value of your inventory.
- Now, you must wonder if bringing down the floor price would mean lower revenue, but that’s not the case. In fact, it ends up positively affecting your revenue generation efforts.
| CPM Floor | Page RPM | Coverage | Fill Rate | Unfilled Impressions |
| $1.00 | $2.00 | 70% | 80% | 20,000 |
| $0.50 | $1.20 | 80% | 85% | 15,000 |
| $0.45 | $1.15 | 85% | 87% | 13,000 |
| $0.40 | $1.10 | 90% | 90% | 10,000 |
| $0.35 | $1.05 | 95% | 92% | 8,000 |
| $0.30 | $1.00 | 97% | 95% | 5,000 |
In this example, the publisher starts by reducing their CPM floor by 50%, from $1.00 to $0.50. This results in a lower Page RPM but an increase in coverage and fill rate, meaning more of their ad inventory is being sold. The percentage of unfilled impressions also drops from 20,000 to 15,000.
The publisher continues to adjust the CPM floor in $0.05 increments until they find the “sweet spot” where they balance their desire for higher CPMs with their need to sell more of their inventory. In this case, they settle on a CPM floor of $0.35, which results in a Page RPM of $1.05, a coverage rate of 95%, a fill rate of 92%, and only 8,000 unfilled impressions.
You can try inflating your CPM if that’s not what you want.
In an effort to maximize your revenue during Q1, you can also create a new Private Auction and set the deal name in a way that reflects the season. For example, “Q1” or “Winter”. After that, you can set a floor CPM 50-100% higher than your average CPM for the rest of the year.
For example, if your average CPM is $2.50, you can set a floor CPM of $4.00 for Q1.
To illustrate the potential impact of this strategy, consider the following table showing the estimated revenue for different geolocations based on an increased floor CPM during Q1:
| Geolocation | Average CPM | Q1 Floor CPM | Estimated Q1 Revenue |
| US | $2.50 | $4.00 | $25,000 |
| Canada | $2.00 | $3.50 | $7,000 |
| UK | $3.00 | $5.00 | $10,000 |
By setting a higher floor CPM during Q1; you can potentially increase your estimated revenue by 50-100% compared to your average CPM for the rest of the year.
Q2
Now, this is the time when more and more advertisers start showing up. As mentioned earlier, advertisers usually plan and allocate their ad budget.
In fact, Socialbakers, the leading unified social media marketing platform, reported that the global cost-per-click (CPC) for pay-per-click (PPC) campaigns increased by 55.3% from Q1 to Q2, rising from $0.076 to $0.118 per click. The CPC in North America rose by 31.1% during the same period. This means that advertisers paid significantly more for each click during Q2 than in Q1, highlighting the potential impact of seasonality on advertising costs.
In Q2, publishers will notice that their websites are performing much better than last quarter, which means they should do whatever they can to improve their revenue generation. The following points can be of help for the same.
- If you were able to handle Q1 in a good manner, you would notice that traffic and user engagement has increased in the second quarter. In order to leverage it, you can try increasing the floor price for your inventory to get more revenue.
- Check if the ad formats you used last quarter are performing well. If they haven’t led to increased ad viewability, you should consider discarding them and using ad formats that work for you.
- In the second quarter, you can also leverage honorifics, namely Mother’s Day, Memorial Day, and Father’s Day.
Another strategy to increase revenue is to raise CPM floors gradually. Begin by making small adjustments of $0.02 to the CPM floor and track the changes in fill rate and page RPM. If the fill rate remains consistent and the page RPM increases, continue to increase the CPM floor.
For example, consider the following table, which illustrates the impact of increasing the CPM floor on fill rate and page RPM:
| CPM Floor | Fill Rate | Page RPM |
|---|---|---|
| $0.50 | 85% | $1.50 |
| $0.52 | 83% | $1.55 |
| $0.54 | 80% | $1.60 |
| $0.56 | 78% | $1.65 |
As you can see, gradually increasing the CPM floor can lead to a higher page RPM. However, it’s important also to keep an eye on the fill rate, as too high of a CPM floor can negatively impact the ad fill rate.
Note: Avoid making any major changes to your website on dates of any kinds of events or holidays in order to prevent any technical problems.
Also Read – Fighting the Summer Slump: Damage Control Tips
Q3
In this quarter, the performance of websites is not as bad as the first one but can still dwindle a bit. Publishers will again have to pay attention to important factors to earn as much from their websites as possible.
- You can start the quarter by reducing the floor price a little and then try increasing it again in the middle of the quarter. The changes don’t have to be as drastic as the first quarter, but you must readjust and see what works best.
- Q3 is also the time when you need to prepare for Q4. In order to do this, you should focus on optimizing your inventory. Experiment with different ad placements, ad formats, and ad units. By the end of the quarter, you should have figured out which ad formats and placements have higher viewability.
- Like the first quarter, you can also try PMP deals in this Q3. This will be helpful if you think your inventory is not getting adequate deals through conventional methods.
- 4th of July and Labor Day are two days to look out for this quarter.
Q4
This quarter is probably the most exciting time for a lot of publishers. If you are being provided with many opportunities, you should also know how to make the most of them. Consider the following points for making the most of these ad tech trends.
- Make sure that you are aware of the different holidays and events that fall in this quarter. This means that even if you belong to a country where a festival or event is not a big deal, you should still be taking measures to optimize your inventory accordingly. This is because your users may belong to the place where that festival or event is celebrated.
- Right at the beginning of the quarter you should test if all important aspects of your website are working properly or not. This would mean developing an effective traffic strategy, decreasing page latency, optimizing keyword research, and checking your website’s performance on different devices.
- This is a time when ad viewability for your creatives should be high. Since more users are browsing and more customers are purchasing things, optimizing for ad viewability will be of great help for increasing your revenue.
- It goes without saying that you should be increasing floor prices in this quarter to get as high returns as possible.
- You can take advantage of dynamic allocation in this quarter to maximize your revenue. Adsense and Ad Exchange line items make use of this feature automatically. This can help increase your revenue without compromising your guaranteed deals. Dynamic allocation is a great way to take care of the remnant inventory on your website.
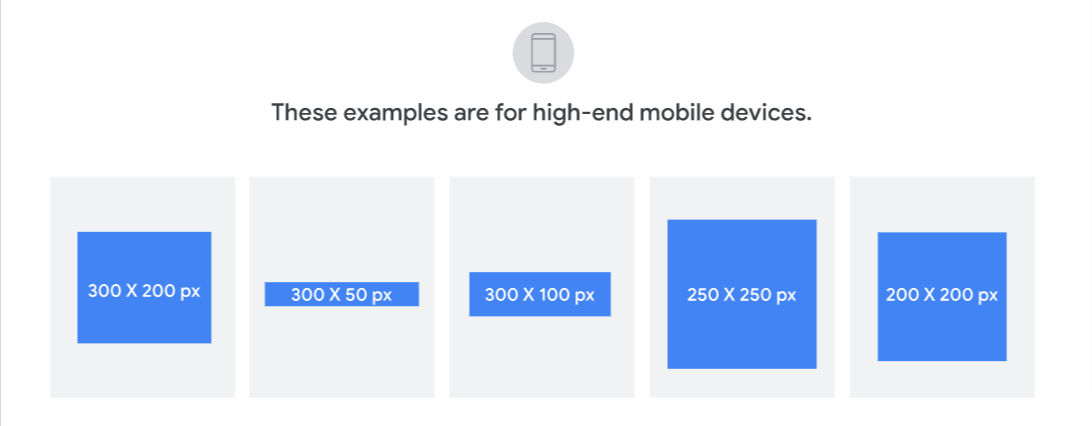
In Q4, optimising your ad sizes and formats for maximum revenue can make a vast difference. Consider focusing on high-paying ad sizes while avoiding non-standard ad formats that might obscure or make other ad units non-viewable.
Here are some recommended ad sizes per device:
Desktop: 300×600, 160×600, 728×90, 300×250
Mobile: 300×250, 320×50, 336×280, 728×90
By focusing on these recommended sizes and formats, you can increase the visibility and effectiveness of your ads while maximizing your revenue during the crucial Q4 period.
You can also head to Google Support for a fair understanding of common ad sizes.
- Lastly, using tools such as Google Analytics and Google Ad Manager insights to track user engagement and website’s performance will give you the needed insights for optimizing your site.
Also Read – 29 Ways to Manage Your Revenue During an AdOps Recession
Final Thoughts on Seasonality Trends
Publishers need to understand that seasonal patterns and changes are going to occur inevitably. If your revenue declines in one quarter you can always incorporate necessary changes to increase it in the next one.
Furthermore, you should also keep up with the latest trends going on in the industry to be with the pace.
Ad Tech Trends to Watch in 2025
According to Martech 360, here are a few trends to stay abreast of:
- As third-party cookies quickly disappear—over half are already gone—and Google’s big move in July 2024 now giving users control over cookie settings, it’s high time to find reliable alternatives that can keep up. [Source: Newswire]
- Short videos on TikTok, YouTube Shorts, and Instagram Reels are reshaping audience engagement with quick, captivating visuals that grab attention. As video content continues to dominate, brands are using these formats to deliver impactful messages swiftly, making video a must-have in modern marketing strategies. [Source: Warroominc]
- Voice search and audio ads on Spotify and podcasts are reshaping engagement. Optimizing for voice helps brands capture queries directly, while audio ads reach multitaskers effortlessly. Adapting to this trend keeps you competitive. [Source: Warroominc]
More importantly, publishers should know what tactics they should use at what time to make the most of each phase. In addition to this, preparing for the coming quarter is highly recommended for leveraging every opportunity that presents itself. Adhering to the above-mentioned points can help publishers to take advantage of seasonality trends.
Frequently Asked Questions
Any predictable fluctuation or pattern that recurs or repeats over a one-year period is said to be seasonal. Rewrite this in a conversational manner
CPM trends often follow a seasonal pattern, with traffic and rates usually starting to increase in September, peaking in late November, and then tapering off back to normal in January. To capitalize on this uptick, it’s a good idea to optimize your site and create relevant content well in advance.
Yes true that these fluctuations happens during specific times of the year. It can also have an impact on the publishers’ ad revenue.
In addition to this, seasonality is not specifically a trend, but it’s a variation that takes place at specific regular intervals for a certain time period, which ends up affecting publishers.
A survey conducted by Digiday found out 85% of publishers that were surveyed agreed that their ad sales will be affected by the recession in the mentioned year.

Reviewed by Deepak Sharma, Content Editor at Adpushup As part of AdPushup’s content team. Deepak Sharma handles editorial review and content optimization for adtech articles. He focuses on clarity and accuracy to help readers understand advertising technology topics.